Immigrants from Egypt vs Spaniard In Labor Force | Age 25-29
COMPARE
Immigrants from Egypt
Spaniard
In Labor Force | Age 25-29
In Labor Force | Age 25-29 Comparison
Immigrants from Egypt
Spaniards
85.2%
IN LABOR FORCE | AGE 25-29
97.7/ 100
METRIC RATING
78th/ 347
METRIC RANK
83.7%
IN LABOR FORCE | AGE 25-29
0.2/ 100
METRIC RATING
254th/ 347
METRIC RANK
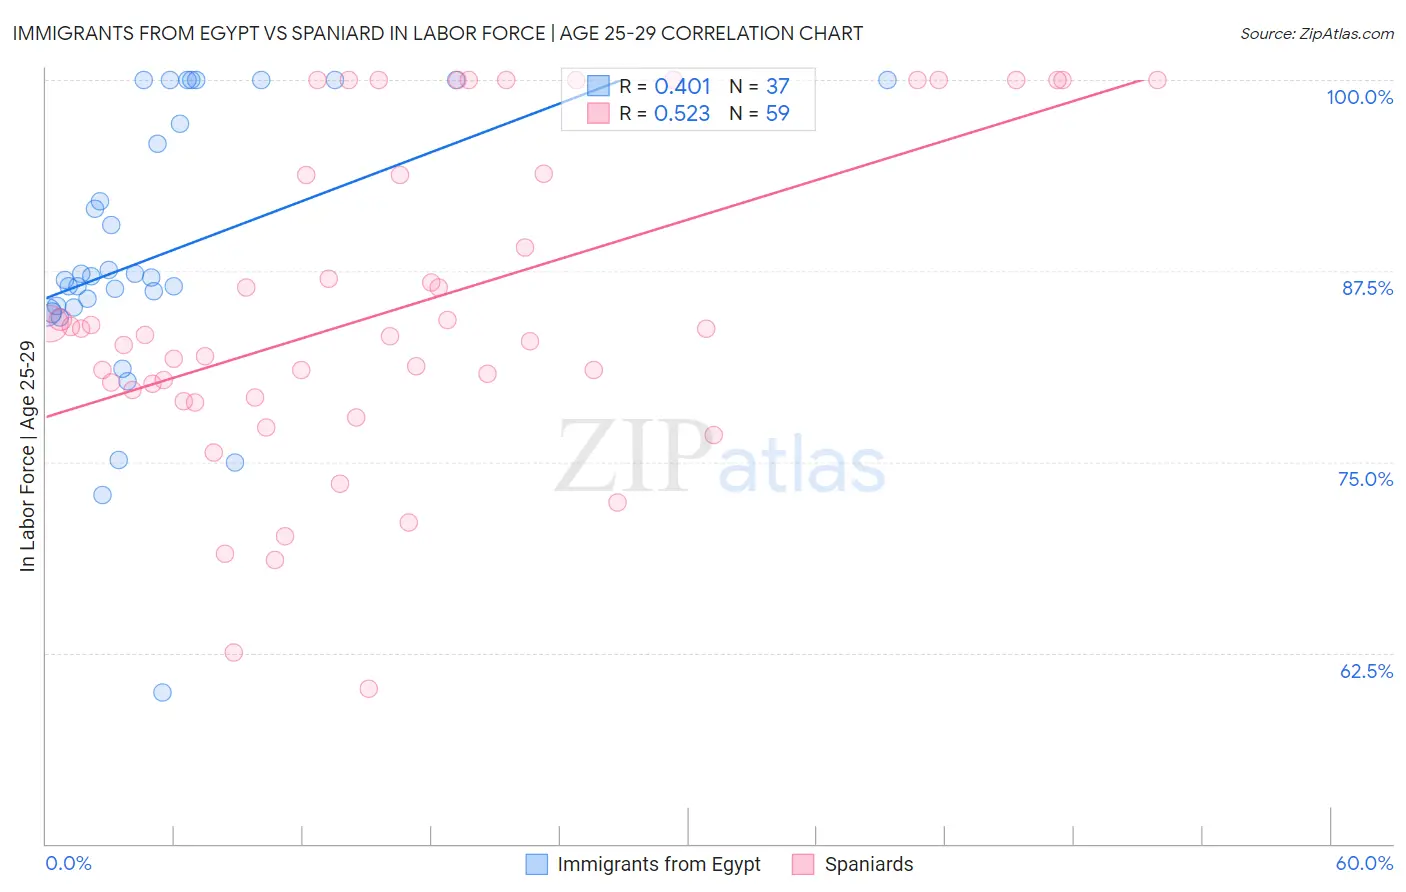
Immigrants from Egypt vs Spaniard In Labor Force | Age 25-29 Correlation Chart
The statistical analysis conducted on geographies consisting of 245,441,194 people shows a moderate positive correlation between the proportion of Immigrants from Egypt and labor force participation rate among population between the ages 25 and 29 in the United States with a correlation coefficient (R) of 0.401 and weighted average of 85.2%. Similarly, the statistical analysis conducted on geographies consisting of 443,266,426 people shows a substantial positive correlation between the proportion of Spaniards and labor force participation rate among population between the ages 25 and 29 in the United States with a correlation coefficient (R) of 0.523 and weighted average of 83.7%, a difference of 1.9%.
In Labor Force | Age 25-29 Correlation Summary
| Measurement | Immigrants from Egypt | Spaniard |
| Minimum | 59.9% | 60.2% |
| Maximum | 100.0% | 100.0% |
| Range | 40.1% | 39.8% |
| Mean | 88.6% | 85.1% |
| Median | 87.1% | 83.3% |
| Interquartile 25% (IQ1) | 85.0% | 79.2% |
| Interquartile 75% (IQ3) | 98.6% | 93.8% |
| Interquartile Range (IQR) | 13.6% | 14.6% |
| Standard Deviation (Sample) | 9.1% | 10.5% |
| Standard Deviation (Population) | 9.0% | 10.4% |
Similar Demographics by In Labor Force | Age 25-29
Demographics Similar to Immigrants from Egypt by In Labor Force | Age 25-29
In terms of in labor force | age 25-29, the demographic groups most similar to Immigrants from Egypt are Immigrants from Northern Africa (85.2%, a difference of 0.010%), Immigrants from Zimbabwe (85.2%, a difference of 0.010%), Immigrants from South Central Asia (85.2%, a difference of 0.020%), German (85.3%, a difference of 0.030%), and Immigrants from Northern Europe (85.2%, a difference of 0.030%).
| Demographics | Rating | Rank | In Labor Force | Age 25-29 |
| Kenyans | 99.0 /100 | #71 | Exceptional 85.4% |
| Immigrants | Australia | 98.9 /100 | #72 | Exceptional 85.3% |
| Russians | 98.8 /100 | #73 | Exceptional 85.3% |
| Soviet Union | 98.5 /100 | #74 | Exceptional 85.3% |
| Brazilians | 98.3 /100 | #75 | Exceptional 85.3% |
| Germans | 98.1 /100 | #76 | Exceptional 85.3% |
| Immigrants | South Central Asia | 97.9 /100 | #77 | Exceptional 85.2% |
| Immigrants | Egypt | 97.7 /100 | #78 | Exceptional 85.2% |
| Immigrants | Northern Africa | 97.6 /100 | #79 | Exceptional 85.2% |
| Immigrants | Zimbabwe | 97.6 /100 | #80 | Exceptional 85.2% |
| Immigrants | Northern Europe | 97.2 /100 | #81 | Exceptional 85.2% |
| Okinawans | 97.0 /100 | #82 | Exceptional 85.2% |
| Immigrants | Europe | 96.8 /100 | #83 | Exceptional 85.2% |
| Immigrants | Eastern Europe | 96.8 /100 | #84 | Exceptional 85.2% |
| Immigrants | Africa | 96.7 /100 | #85 | Exceptional 85.2% |
Demographics Similar to Spaniards by In Labor Force | Age 25-29
In terms of in labor force | age 25-29, the demographic groups most similar to Spaniards are Guatemalan (83.7%, a difference of 0.0%), Immigrants from Trinidad and Tobago (83.7%, a difference of 0.0%), Bahamian (83.7%, a difference of 0.010%), Haitian (83.7%, a difference of 0.010%), and Immigrants from Haiti (83.7%, a difference of 0.020%).
| Demographics | Rating | Rank | In Labor Force | Age 25-29 |
| Immigrants | El Salvador | 0.3 /100 | #247 | Tragic 83.7% |
| Immigrants | Nonimmigrants | 0.3 /100 | #248 | Tragic 83.7% |
| Hmong | 0.3 /100 | #249 | Tragic 83.7% |
| Central Americans | 0.2 /100 | #250 | Tragic 83.7% |
| Bahamians | 0.2 /100 | #251 | Tragic 83.7% |
| Guatemalans | 0.2 /100 | #252 | Tragic 83.7% |
| Immigrants | Trinidad and Tobago | 0.2 /100 | #253 | Tragic 83.7% |
| Spaniards | 0.2 /100 | #254 | Tragic 83.7% |
| Haitians | 0.2 /100 | #255 | Tragic 83.7% |
| Immigrants | Haiti | 0.2 /100 | #256 | Tragic 83.7% |
| Delaware | 0.2 /100 | #257 | Tragic 83.7% |
| Immigrants | Guatemala | 0.1 /100 | #258 | Tragic 83.6% |
| Spanish | 0.1 /100 | #259 | Tragic 83.6% |
| Immigrants | Bahamas | 0.1 /100 | #260 | Tragic 83.6% |
| Pennsylvania Germans | 0.1 /100 | #261 | Tragic 83.6% |