Subsaharan African vs New Zealander Associate's Degree
COMPARE
Subsaharan African
New Zealander
Associate's Degree
Associate's Degree Comparison
Sub-Saharan Africans
New Zealanders
43.9%
ASSOCIATE'S DEGREE
5.5/ 100
METRIC RATING
223rd/ 347
METRIC RANK
51.8%
ASSOCIATE'S DEGREE
99.8/ 100
METRIC RATING
58th/ 347
METRIC RANK
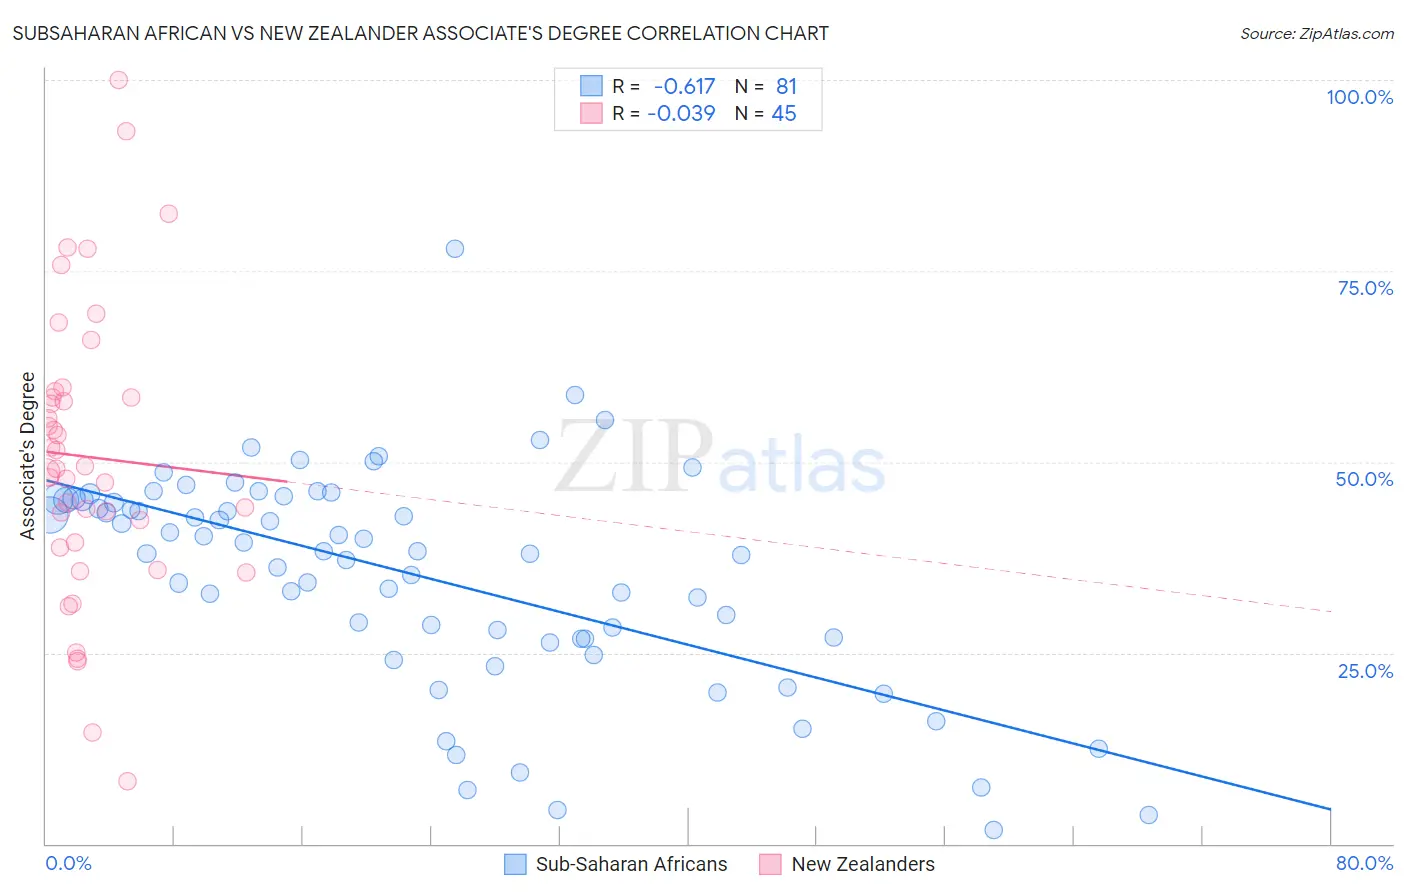
Subsaharan African vs New Zealander Associate's Degree Correlation Chart
The statistical analysis conducted on geographies consisting of 508,152,134 people shows a significant negative correlation between the proportion of Sub-Saharan Africans and percentage of population with at least associate's degree education in the United States with a correlation coefficient (R) of -0.617 and weighted average of 43.9%. Similarly, the statistical analysis conducted on geographies consisting of 106,916,688 people shows no correlation between the proportion of New Zealanders and percentage of population with at least associate's degree education in the United States with a correlation coefficient (R) of -0.039 and weighted average of 51.8%, a difference of 18.0%.
Associate's Degree Correlation Summary
| Measurement | Subsaharan African | New Zealander |
| Minimum | 1.7% | 8.2% |
| Maximum | 78.0% | 100.0% |
| Range | 76.2% | 91.8% |
| Mean | 35.2% | 50.7% |
| Median | 38.3% | 49.1% |
| Interquartile 25% (IQ1) | 26.9% | 39.1% |
| Interquartile 75% (IQ3) | 45.1% | 58.9% |
| Interquartile Range (IQR) | 18.2% | 19.8% |
| Standard Deviation (Sample) | 14.2% | 19.0% |
| Standard Deviation (Population) | 14.1% | 18.8% |
Similar Demographics by Associate's Degree
Demographics Similar to Sub-Saharan Africans by Associate's Degree
In terms of associate's degree, the demographic groups most similar to Sub-Saharan Africans are Barbadian (43.9%, a difference of 0.10%), West Indian (43.8%, a difference of 0.14%), Guamanian/Chamorro (43.8%, a difference of 0.29%), Immigrants from Western Africa (44.1%, a difference of 0.37%), and Immigrants from Burma/Myanmar (43.7%, a difference of 0.51%).
| Demographics | Rating | Rank | Associate's Degree |
| Immigrants | Nigeria | 11.4 /100 | #216 | Poor 44.6% |
| Immigrants | Immigrants | 10.5 /100 | #217 | Poor 44.5% |
| Spanish | 9.4 /100 | #218 | Tragic 44.4% |
| Whites/Caucasians | 7.5 /100 | #219 | Tragic 44.2% |
| Portuguese | 7.2 /100 | #220 | Tragic 44.1% |
| Immigrants | Western Africa | 6.6 /100 | #221 | Tragic 44.1% |
| Barbadians | 5.8 /100 | #222 | Tragic 43.9% |
| Sub-Saharan Africans | 5.5 /100 | #223 | Tragic 43.9% |
| West Indians | 5.2 /100 | #224 | Tragic 43.8% |
| Guamanians/Chamorros | 4.8 /100 | #225 | Tragic 43.8% |
| Immigrants | Burma/Myanmar | 4.3 /100 | #226 | Tragic 43.7% |
| Trinidadians and Tobagonians | 4.0 /100 | #227 | Tragic 43.6% |
| Hmong | 3.2 /100 | #228 | Tragic 43.4% |
| Immigrants | Trinidad and Tobago | 3.0 /100 | #229 | Tragic 43.3% |
| Immigrants | Barbados | 2.9 /100 | #230 | Tragic 43.3% |
Demographics Similar to New Zealanders by Associate's Degree
In terms of associate's degree, the demographic groups most similar to New Zealanders are Paraguayan (51.8%, a difference of 0.030%), Immigrants from Serbia (51.7%, a difference of 0.13%), Immigrants from Czechoslovakia (51.9%, a difference of 0.15%), Australian (51.9%, a difference of 0.17%), and Immigrants from Spain (51.9%, a difference of 0.20%).
| Demographics | Rating | Rank | Associate's Degree |
| Immigrants | Greece | 99.9 /100 | #51 | Exceptional 52.1% |
| Bolivians | 99.8 /100 | #52 | Exceptional 52.0% |
| Immigrants | Asia | 99.8 /100 | #53 | Exceptional 52.0% |
| Immigrants | Spain | 99.8 /100 | #54 | Exceptional 51.9% |
| Australians | 99.8 /100 | #55 | Exceptional 51.9% |
| Immigrants | Czechoslovakia | 99.8 /100 | #56 | Exceptional 51.9% |
| Paraguayans | 99.8 /100 | #57 | Exceptional 51.8% |
| New Zealanders | 99.8 /100 | #58 | Exceptional 51.8% |
| Immigrants | Serbia | 99.8 /100 | #59 | Exceptional 51.7% |
| Immigrants | Bolivia | 99.7 /100 | #60 | Exceptional 51.5% |
| Immigrants | Kazakhstan | 99.7 /100 | #61 | Exceptional 51.4% |
| Bhutanese | 99.7 /100 | #62 | Exceptional 51.4% |
| South Africans | 99.7 /100 | #63 | Exceptional 51.4% |
| Immigrants | Netherlands | 99.7 /100 | #64 | Exceptional 51.4% |
| Zimbabweans | 99.7 /100 | #65 | Exceptional 51.3% |