Immigrants from Europe vs New Zealander In Labor Force | Age 25-29
COMPARE
Immigrants from Europe
New Zealander
In Labor Force | Age 25-29
In Labor Force | Age 25-29 Comparison
Immigrants from Europe
New Zealanders
85.2%
IN LABOR FORCE | AGE 25-29
96.8/ 100
METRIC RATING
83rd/ 347
METRIC RANK
85.0%
IN LABOR FORCE | AGE 25-29
91.5/ 100
METRIC RATING
110th/ 347
METRIC RANK
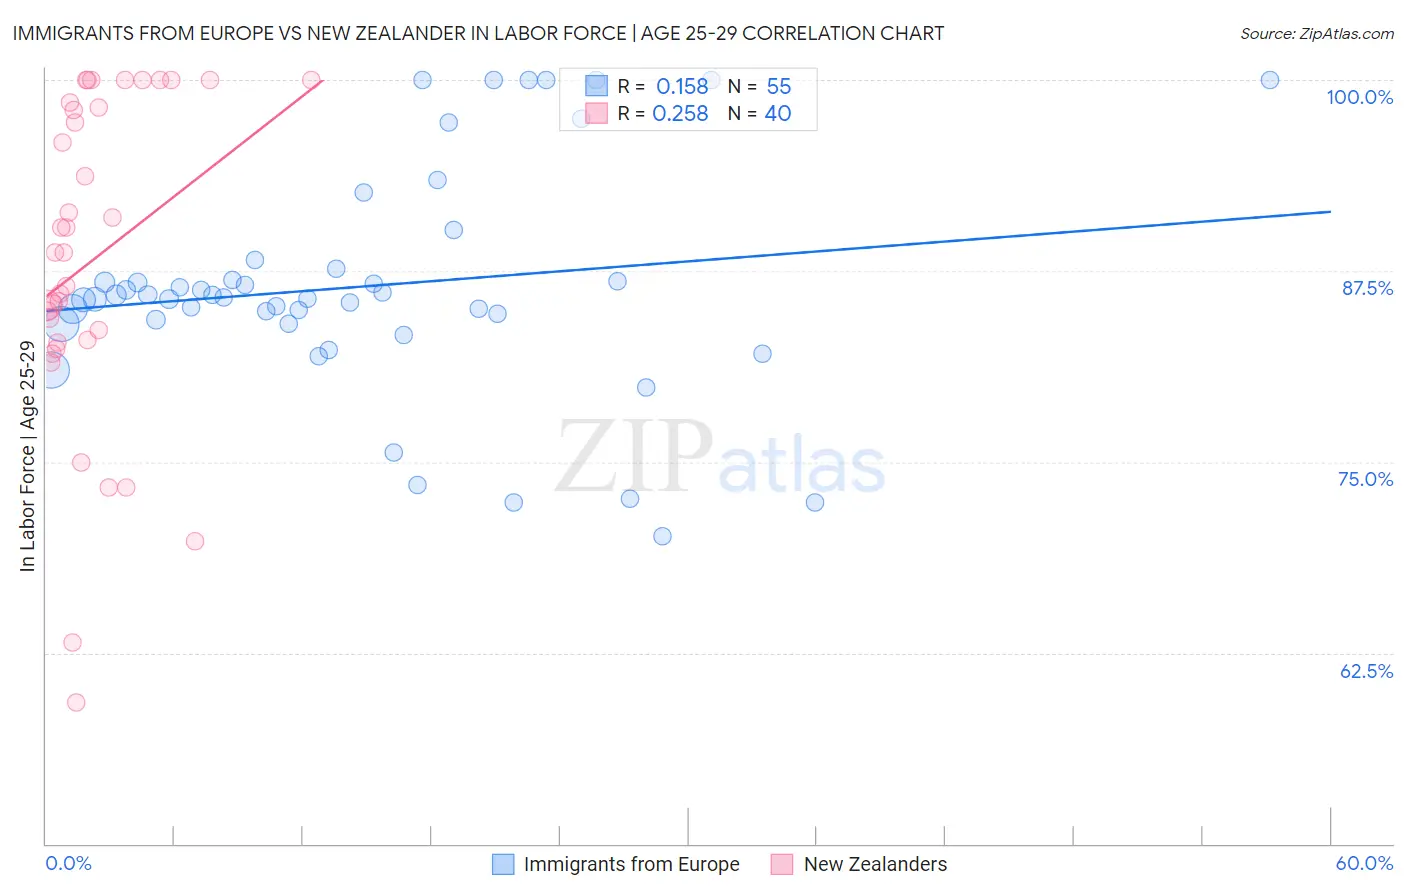
Immigrants from Europe vs New Zealander In Labor Force | Age 25-29 Correlation Chart
The statistical analysis conducted on geographies consisting of 546,633,730 people shows a poor positive correlation between the proportion of Immigrants from Europe and labor force participation rate among population between the ages 25 and 29 in the United States with a correlation coefficient (R) of 0.158 and weighted average of 85.2%. Similarly, the statistical analysis conducted on geographies consisting of 106,898,789 people shows a weak positive correlation between the proportion of New Zealanders and labor force participation rate among population between the ages 25 and 29 in the United States with a correlation coefficient (R) of 0.258 and weighted average of 85.0%, a difference of 0.19%.
In Labor Force | Age 25-29 Correlation Summary
| Measurement | Immigrants from Europe | New Zealander |
| Minimum | 70.1% | 59.3% |
| Maximum | 100.0% | 100.0% |
| Range | 29.9% | 40.7% |
| Mean | 86.5% | 88.2% |
| Median | 85.8% | 88.7% |
| Interquartile 25% (IQ1) | 84.1% | 82.9% |
| Interquartile 75% (IQ3) | 87.6% | 98.4% |
| Interquartile Range (IQR) | 3.5% | 15.5% |
| Standard Deviation (Sample) | 7.4% | 10.6% |
| Standard Deviation (Population) | 7.3% | 10.5% |
Similar Demographics by In Labor Force | Age 25-29
Demographics Similar to Immigrants from Europe by In Labor Force | Age 25-29
In terms of in labor force | age 25-29, the demographic groups most similar to Immigrants from Europe are Immigrants from Eastern Europe (85.2%, a difference of 0.0%), Okinawan (85.2%, a difference of 0.010%), Immigrants from Africa (85.2%, a difference of 0.010%), Ukrainian (85.2%, a difference of 0.010%), and French Canadian (85.2%, a difference of 0.020%).
| Demographics | Rating | Rank | In Labor Force | Age 25-29 |
| Germans | 98.1 /100 | #76 | Exceptional 85.3% |
| Immigrants | South Central Asia | 97.9 /100 | #77 | Exceptional 85.2% |
| Immigrants | Egypt | 97.7 /100 | #78 | Exceptional 85.2% |
| Immigrants | Northern Africa | 97.6 /100 | #79 | Exceptional 85.2% |
| Immigrants | Zimbabwe | 97.6 /100 | #80 | Exceptional 85.2% |
| Immigrants | Northern Europe | 97.2 /100 | #81 | Exceptional 85.2% |
| Okinawans | 97.0 /100 | #82 | Exceptional 85.2% |
| Immigrants | Europe | 96.8 /100 | #83 | Exceptional 85.2% |
| Immigrants | Eastern Europe | 96.8 /100 | #84 | Exceptional 85.2% |
| Immigrants | Africa | 96.7 /100 | #85 | Exceptional 85.2% |
| Ukrainians | 96.7 /100 | #86 | Exceptional 85.2% |
| French Canadians | 96.5 /100 | #87 | Exceptional 85.2% |
| Immigrants | Croatia | 96.4 /100 | #88 | Exceptional 85.2% |
| Immigrants | France | 96.3 /100 | #89 | Exceptional 85.2% |
| Burmese | 95.9 /100 | #90 | Exceptional 85.1% |
Demographics Similar to New Zealanders by In Labor Force | Age 25-29
In terms of in labor force | age 25-29, the demographic groups most similar to New Zealanders are Immigrants from Middle Africa (85.0%, a difference of 0.0%), Immigrants from Austria (85.0%, a difference of 0.010%), Costa Rican (85.0%, a difference of 0.010%), Senegalese (85.0%, a difference of 0.010%), and Immigrants from Southern Europe (85.0%, a difference of 0.020%).
| Demographics | Rating | Rank | In Labor Force | Age 25-29 |
| Immigrants | Japan | 93.5 /100 | #103 | Exceptional 85.1% |
| Immigrants | Zaire | 93.3 /100 | #104 | Exceptional 85.1% |
| Immigrants | Hong Kong | 92.8 /100 | #105 | Exceptional 85.0% |
| Czechoslovakians | 92.6 /100 | #106 | Exceptional 85.0% |
| Immigrants | Southern Europe | 92.3 /100 | #107 | Exceptional 85.0% |
| Immigrants | Austria | 91.9 /100 | #108 | Exceptional 85.0% |
| Costa Ricans | 91.9 /100 | #109 | Exceptional 85.0% |
| New Zealanders | 91.5 /100 | #110 | Exceptional 85.0% |
| Immigrants | Middle Africa | 91.4 /100 | #111 | Exceptional 85.0% |
| Senegalese | 90.9 /100 | #112 | Exceptional 85.0% |
| Irish | 90.6 /100 | #113 | Exceptional 85.0% |
| Immigrants | Malaysia | 90.4 /100 | #114 | Exceptional 85.0% |
| South Africans | 88.9 /100 | #115 | Excellent 85.0% |
| Chileans | 88.8 /100 | #116 | Excellent 85.0% |
| Immigrants | Belarus | 88.0 /100 | #117 | Excellent 85.0% |