Immigrants from Cambodia vs Marshallese In Labor Force | Age > 16
COMPARE
Immigrants from Cambodia
Marshallese
In Labor Force | Age > 16
In Labor Force | Age > 16 Comparison
Immigrants from Cambodia
Marshallese
66.0%
IN LABOR FORCE | AGE > 16
99.1/ 100
METRIC RATING
94th/ 347
METRIC RANK
64.2%
IN LABOR FORCE | AGE > 16
0.7/ 100
METRIC RATING
260th/ 347
METRIC RANK
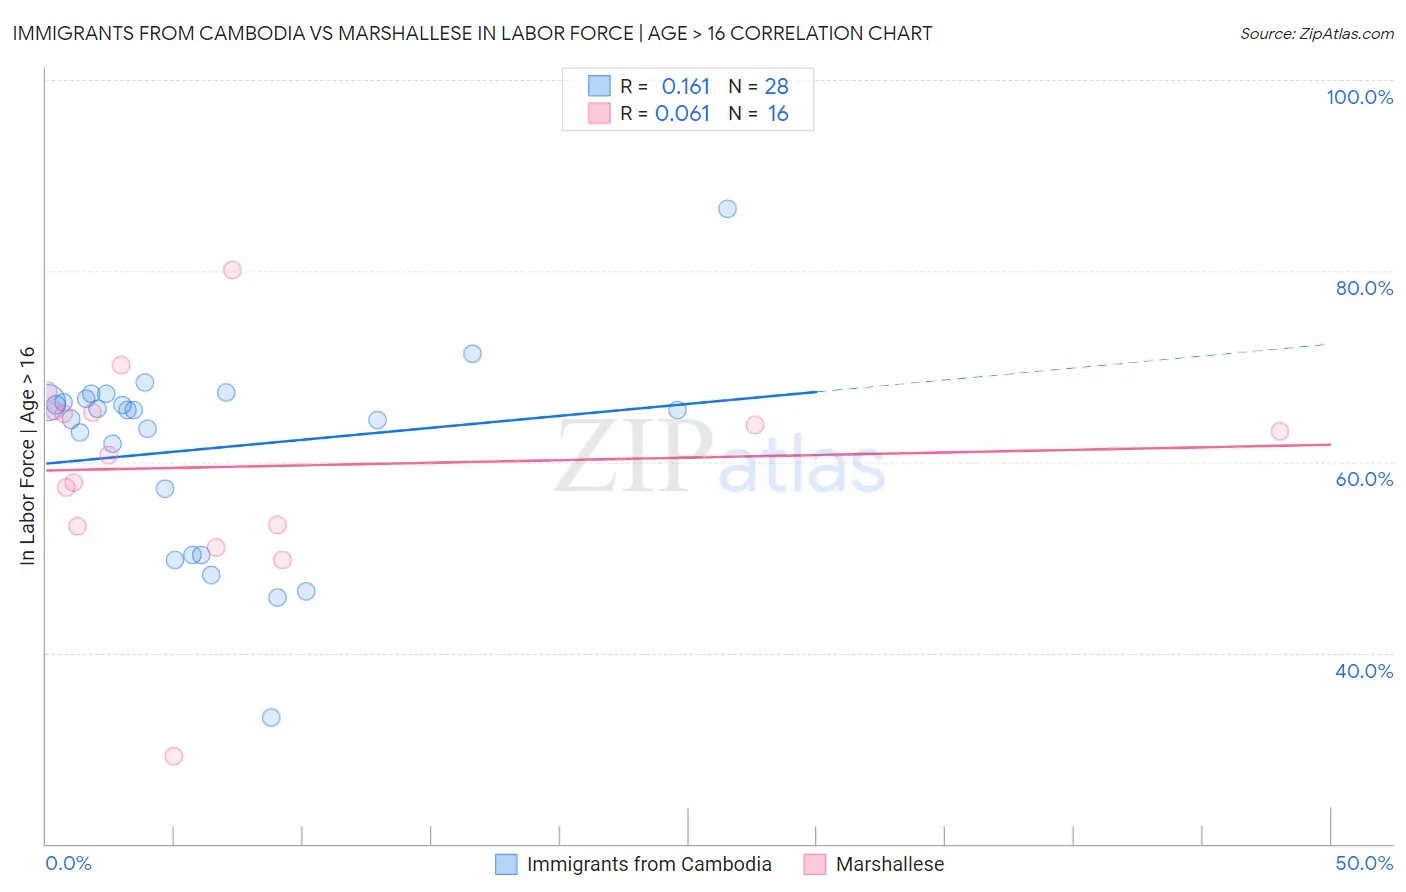
Immigrants from Cambodia vs Marshallese In Labor Force | Age > 16 Correlation Chart
The statistical analysis conducted on geographies consisting of 205,156,117 people shows a poor positive correlation between the proportion of Immigrants from Cambodia and labor force participation rate among population ages 16 and over in the United States with a correlation coefficient (R) of 0.161 and weighted average of 66.0%. Similarly, the statistical analysis conducted on geographies consisting of 14,761,315 people shows a slight positive correlation between the proportion of Marshallese and labor force participation rate among population ages 16 and over in the United States with a correlation coefficient (R) of 0.061 and weighted average of 64.2%, a difference of 2.7%.
In Labor Force | Age > 16 Correlation Summary
| Measurement | Immigrants from Cambodia | Marshallese |
| Minimum | 33.2% | 29.2% |
| Maximum | 86.5% | 80.1% |
| Range | 53.3% | 50.9% |
| Mean | 61.4% | 59.5% |
| Median | 65.4% | 62.0% |
| Interquartile 25% (IQ1) | 53.7% | 53.3% |
| Interquartile 75% (IQ3) | 66.4% | 65.2% |
| Interquartile Range (IQR) | 12.8% | 11.9% |
| Standard Deviation (Sample) | 10.4% | 11.2% |
| Standard Deviation (Population) | 10.2% | 10.9% |
Similar Demographics by In Labor Force | Age > 16
Demographics Similar to Immigrants from Cambodia by In Labor Force | Age > 16
In terms of in labor force | age > 16, the demographic groups most similar to Immigrants from Cambodia are Immigrants from Uruguay (66.0%, a difference of 0.0%), Aleut (66.0%, a difference of 0.020%), Immigrants from South America (66.0%, a difference of 0.020%), Iranian (66.0%, a difference of 0.040%), and Immigrants from Laos (66.0%, a difference of 0.050%).
| Demographics | Rating | Rank | In Labor Force | Age > 16 |
| South American Indians | 99.4 /100 | #87 | Exceptional 66.0% |
| Bermudans | 99.3 /100 | #88 | Exceptional 66.0% |
| Immigrants | Laos | 99.2 /100 | #89 | Exceptional 66.0% |
| Chileans | 99.2 /100 | #90 | Exceptional 66.0% |
| Iranians | 99.2 /100 | #91 | Exceptional 66.0% |
| Aleuts | 99.1 /100 | #92 | Exceptional 66.0% |
| Immigrants | South America | 99.1 /100 | #93 | Exceptional 66.0% |
| Immigrants | Cambodia | 99.1 /100 | #94 | Exceptional 66.0% |
| Immigrants | Uruguay | 99.1 /100 | #95 | Exceptional 66.0% |
| Bangladeshis | 98.9 /100 | #96 | Exceptional 65.9% |
| Filipinos | 98.9 /100 | #97 | Exceptional 65.9% |
| Immigrants | Chile | 98.7 /100 | #98 | Exceptional 65.9% |
| Immigrants | Australia | 98.7 /100 | #99 | Exceptional 65.9% |
| Okinawans | 98.7 /100 | #100 | Exceptional 65.9% |
| Immigrants | Colombia | 98.6 /100 | #101 | Exceptional 65.9% |
Demographics Similar to Marshallese by In Labor Force | Age > 16
In terms of in labor force | age > 16, the demographic groups most similar to Marshallese are Basque (64.2%, a difference of 0.0%), Immigrants from Western Europe (64.2%, a difference of 0.010%), Finnish (64.2%, a difference of 0.010%), Bahamian (64.2%, a difference of 0.030%), and Immigrants from Scotland (64.2%, a difference of 0.040%).
| Demographics | Rating | Rank | In Labor Force | Age > 16 |
| Czechoslovakians | 1.4 /100 | #253 | Tragic 64.3% |
| Immigrants | Uzbekistan | 1.4 /100 | #254 | Tragic 64.3% |
| Hispanics or Latinos | 1.1 /100 | #255 | Tragic 64.3% |
| Immigrants | Mexico | 1.0 /100 | #256 | Tragic 64.3% |
| Inupiat | 0.8 /100 | #257 | Tragic 64.3% |
| Immigrants | Scotland | 0.8 /100 | #258 | Tragic 64.2% |
| Immigrants | Western Europe | 0.7 /100 | #259 | Tragic 64.2% |
| Marshallese | 0.7 /100 | #260 | Tragic 64.2% |
| Basques | 0.7 /100 | #261 | Tragic 64.2% |
| Finns | 0.7 /100 | #262 | Tragic 64.2% |
| Bahamians | 0.6 /100 | #263 | Tragic 64.2% |
| Dutch | 0.6 /100 | #264 | Tragic 64.2% |
| Cubans | 0.5 /100 | #265 | Tragic 64.2% |
| Immigrants | England | 0.5 /100 | #266 | Tragic 64.2% |
| Canadians | 0.5 /100 | #267 | Tragic 64.1% |