Sri Lankan vs Bulgarian In Labor Force | Age > 16
COMPARE
Sri Lankan
Bulgarian
In Labor Force | Age > 16
In Labor Force | Age > 16 Comparison
Sri Lankans
Bulgarians
66.3%
IN LABOR FORCE | AGE > 16
99.8/ 100
METRIC RATING
65th/ 347
METRIC RANK
66.4%
IN LABOR FORCE | AGE > 16
99.9/ 100
METRIC RATING
57th/ 347
METRIC RANK
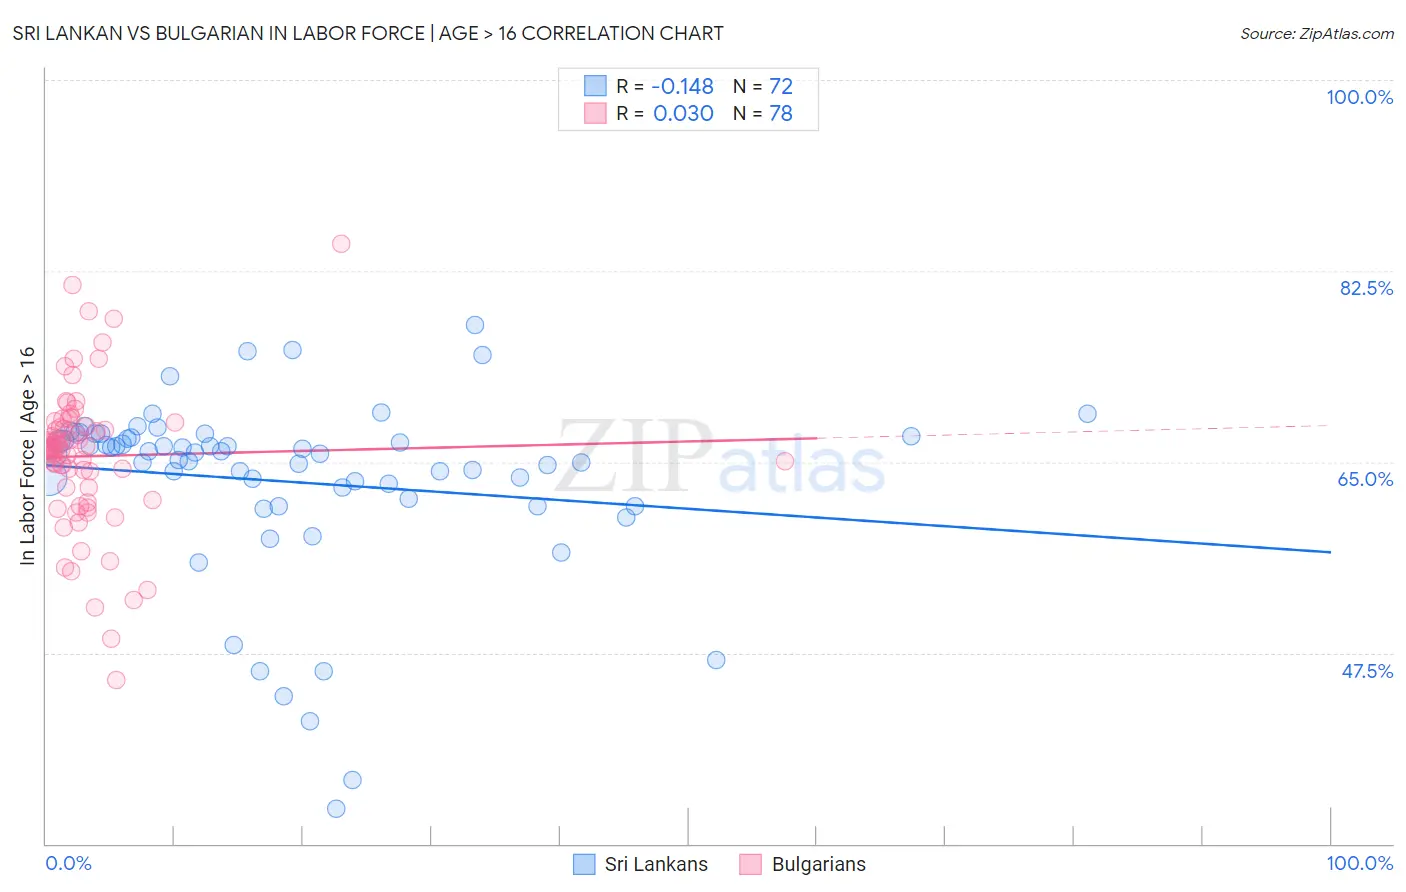
Sri Lankan vs Bulgarian In Labor Force | Age > 16 Correlation Chart
The statistical analysis conducted on geographies consisting of 440,615,850 people shows a poor negative correlation between the proportion of Sri Lankans and labor force participation rate among population ages 16 and over in the United States with a correlation coefficient (R) of -0.148 and weighted average of 66.3%. Similarly, the statistical analysis conducted on geographies consisting of 205,629,160 people shows no correlation between the proportion of Bulgarians and labor force participation rate among population ages 16 and over in the United States with a correlation coefficient (R) of 0.030 and weighted average of 66.4%, a difference of 0.20%.
In Labor Force | Age > 16 Correlation Summary
| Measurement | Sri Lankan | Bulgarian |
| Minimum | 33.2% | 45.0% |
| Maximum | 77.6% | 85.0% |
| Range | 44.4% | 40.0% |
| Mean | 63.2% | 65.5% |
| Median | 65.8% | 66.4% |
| Interquartile 25% (IQ1) | 62.1% | 62.6% |
| Interquartile 75% (IQ3) | 67.2% | 68.2% |
| Interquartile Range (IQR) | 5.1% | 5.6% |
| Standard Deviation (Sample) | 8.5% | 6.7% |
| Standard Deviation (Population) | 8.4% | 6.7% |
Demographics Similar to Sri Lankans and Bulgarians by In Labor Force | Age > 16
In terms of in labor force | age > 16, the demographic groups most similar to Sri Lankans are Venezuelan (66.3%, a difference of 0.010%), Peruvian (66.3%, a difference of 0.010%), Jordanian (66.3%, a difference of 0.020%), Immigrants from Peru (66.3%, a difference of 0.050%), and Immigrants from Burma/Myanmar (66.3%, a difference of 0.050%). Similarly, the demographic groups most similar to Bulgarians are Immigrants from Senegal (66.4%, a difference of 0.010%), Immigrants from Venezuela (66.4%, a difference of 0.040%), Immigrants from Bosnia and Herzegovina (66.5%, a difference of 0.090%), Immigrants from Saudi Arabia (66.3%, a difference of 0.10%), and Immigrants from Sri Lanka (66.5%, a difference of 0.12%).
| Demographics | Rating | Rank | In Labor Force | Age > 16 |
| Immigrants | Kuwait | 100.0 /100 | #51 | Exceptional 66.5% |
| Paraguayans | 99.9 /100 | #52 | Exceptional 66.5% |
| Immigrants | Sri Lanka | 99.9 /100 | #53 | Exceptional 66.5% |
| Immigrants | Bosnia and Herzegovina | 99.9 /100 | #54 | Exceptional 66.5% |
| Immigrants | Venezuela | 99.9 /100 | #55 | Exceptional 66.4% |
| Immigrants | Senegal | 99.9 /100 | #56 | Exceptional 66.4% |
| Bulgarians | 99.9 /100 | #57 | Exceptional 66.4% |
| Immigrants | Saudi Arabia | 99.9 /100 | #58 | Exceptional 66.3% |
| Immigrants | Turkey | 99.9 /100 | #59 | Exceptional 66.3% |
| Immigrants | Peru | 99.8 /100 | #60 | Exceptional 66.3% |
| Immigrants | Burma/Myanmar | 99.8 /100 | #61 | Exceptional 66.3% |
| Indonesians | 99.8 /100 | #62 | Exceptional 66.3% |
| Venezuelans | 99.8 /100 | #63 | Exceptional 66.3% |
| Peruvians | 99.8 /100 | #64 | Exceptional 66.3% |
| Sri Lankans | 99.8 /100 | #65 | Exceptional 66.3% |
| Jordanians | 99.8 /100 | #66 | Exceptional 66.3% |
| Egyptians | 99.8 /100 | #67 | Exceptional 66.2% |
| Immigrants | Egypt | 99.7 /100 | #68 | Exceptional 66.2% |
| Sub-Saharan Africans | 99.7 /100 | #69 | Exceptional 66.2% |
| Asians | 99.7 /100 | #70 | Exceptional 66.2% |
| Burmese | 99.7 /100 | #71 | Exceptional 66.2% |