Crow vs Okinawan In Labor Force | Age 20-24
COMPARE
Crow
Okinawan
In Labor Force | Age 20-24
In Labor Force | Age 20-24 Comparison
Crow
Okinawans
76.9%
IN LABOR FORCE | AGE 20-24
99.9/ 100
METRIC RATING
65th/ 347
METRIC RANK
72.7%
IN LABOR FORCE | AGE 20-24
0.0/ 100
METRIC RATING
295th/ 347
METRIC RANK
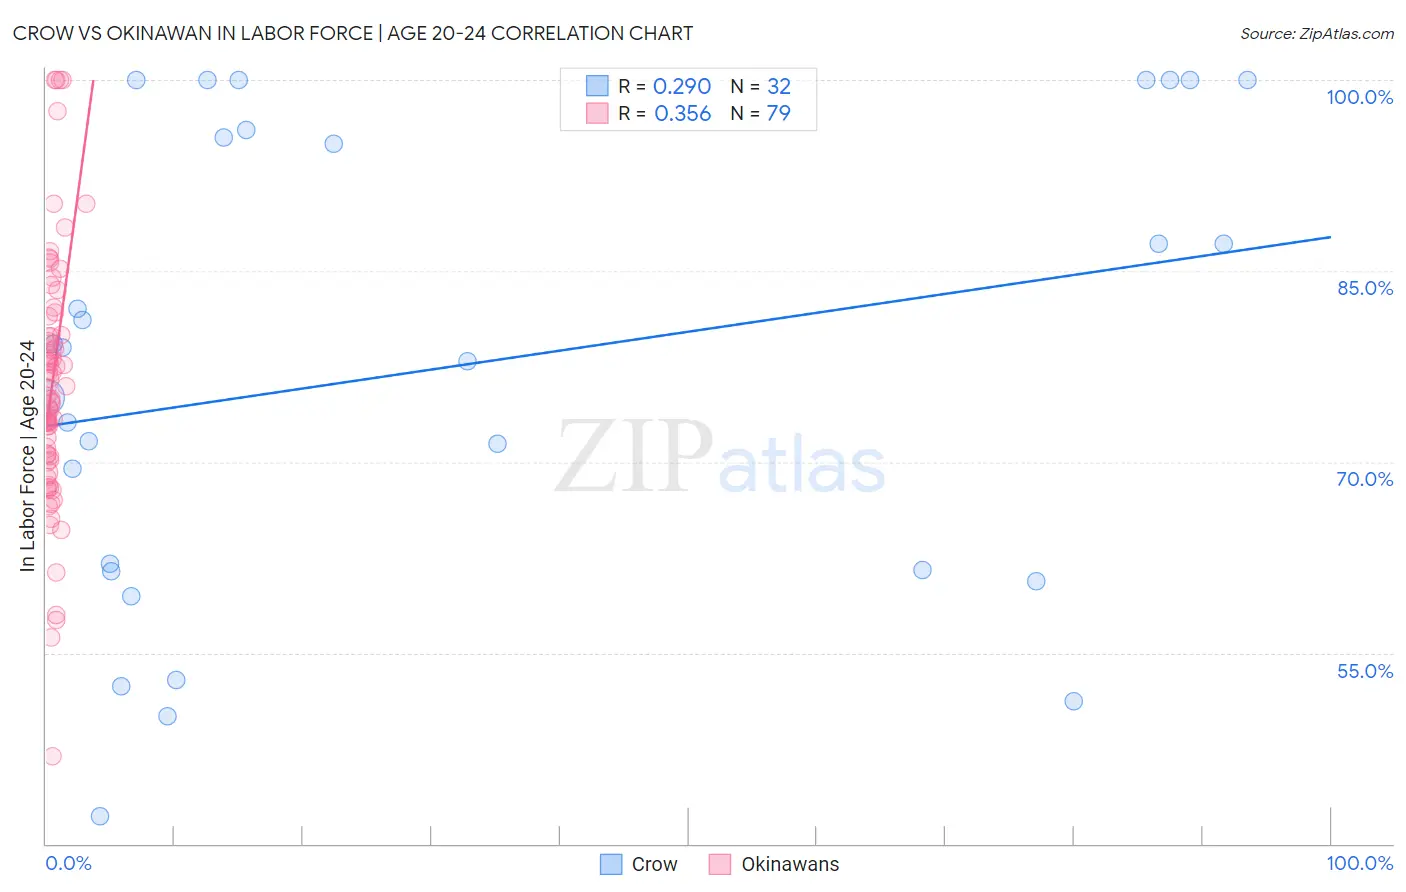
Crow vs Okinawan In Labor Force | Age 20-24 Correlation Chart
The statistical analysis conducted on geographies consisting of 59,196,600 people shows a weak positive correlation between the proportion of Crow and labor force participation rate among population between the ages 20 and 24 in the United States with a correlation coefficient (R) of 0.290 and weighted average of 76.9%. Similarly, the statistical analysis conducted on geographies consisting of 73,779,368 people shows a mild positive correlation between the proportion of Okinawans and labor force participation rate among population between the ages 20 and 24 in the United States with a correlation coefficient (R) of 0.356 and weighted average of 72.7%, a difference of 5.7%.
In Labor Force | Age 20-24 Correlation Summary
| Measurement | Crow | Okinawan |
| Minimum | 42.2% | 46.9% |
| Maximum | 100.0% | 100.0% |
| Range | 57.8% | 53.1% |
| Mean | 77.3% | 76.0% |
| Median | 78.5% | 75.0% |
| Interquartile 25% (IQ1) | 61.5% | 70.2% |
| Interquartile 75% (IQ3) | 95.8% | 80.0% |
| Interquartile Range (IQR) | 34.3% | 9.8% |
| Standard Deviation (Sample) | 18.1% | 9.9% |
| Standard Deviation (Population) | 17.9% | 9.9% |
Similar Demographics by In Labor Force | Age 20-24
Demographics Similar to Crow by In Labor Force | Age 20-24
In terms of in labor force | age 20-24, the demographic groups most similar to Crow are Icelander (76.9%, a difference of 0.020%), Slavic (76.9%, a difference of 0.020%), White/Caucasian (76.9%, a difference of 0.050%), French American Indian (76.8%, a difference of 0.060%), and Immigrants from Sudan (76.8%, a difference of 0.080%).
| Demographics | Rating | Rank | In Labor Force | Age 20-24 |
| Hawaiians | 99.9 /100 | #58 | Exceptional 77.0% |
| Scotch-Irish | 99.9 /100 | #59 | Exceptional 77.0% |
| Kenyans | 99.9 /100 | #60 | Exceptional 77.0% |
| Immigrants | Eritrea | 99.9 /100 | #61 | Exceptional 77.0% |
| Immigrants | Kenya | 99.9 /100 | #62 | Exceptional 77.0% |
| Lithuanians | 99.9 /100 | #63 | Exceptional 77.0% |
| Whites/Caucasians | 99.9 /100 | #64 | Exceptional 76.9% |
| Crow | 99.9 /100 | #65 | Exceptional 76.9% |
| Icelanders | 99.9 /100 | #66 | Exceptional 76.9% |
| Slavs | 99.9 /100 | #67 | Exceptional 76.9% |
| French American Indians | 99.8 /100 | #68 | Exceptional 76.8% |
| Immigrants | Sudan | 99.8 /100 | #69 | Exceptional 76.8% |
| Ottawa | 99.8 /100 | #70 | Exceptional 76.8% |
| Northern Europeans | 99.8 /100 | #71 | Exceptional 76.8% |
| Guamanians/Chamorros | 99.8 /100 | #72 | Exceptional 76.7% |
Demographics Similar to Okinawans by In Labor Force | Age 20-24
In terms of in labor force | age 20-24, the demographic groups most similar to Okinawans are Jamaican (72.7%, a difference of 0.0%), Central American Indian (72.7%, a difference of 0.050%), Immigrants from Argentina (72.8%, a difference of 0.11%), Immigrants from Belize (72.8%, a difference of 0.14%), and Israeli (72.6%, a difference of 0.18%).
| Demographics | Rating | Rank | In Labor Force | Age 20-24 |
| Argentineans | 0.1 /100 | #288 | Tragic 73.1% |
| U.S. Virgin Islanders | 0.1 /100 | #289 | Tragic 73.0% |
| Immigrants | Belarus | 0.1 /100 | #290 | Tragic 73.0% |
| Immigrants | Nicaragua | 0.0 /100 | #291 | Tragic 72.9% |
| Pueblo | 0.0 /100 | #292 | Tragic 72.9% |
| Immigrants | Belize | 0.0 /100 | #293 | Tragic 72.8% |
| Immigrants | Argentina | 0.0 /100 | #294 | Tragic 72.8% |
| Okinawans | 0.0 /100 | #295 | Tragic 72.7% |
| Jamaicans | 0.0 /100 | #296 | Tragic 72.7% |
| Central American Indians | 0.0 /100 | #297 | Tragic 72.7% |
| Israelis | 0.0 /100 | #298 | Tragic 72.6% |
| Iranians | 0.0 /100 | #299 | Tragic 72.6% |
| Armenians | 0.0 /100 | #300 | Tragic 72.5% |
| Cubans | 0.0 /100 | #301 | Tragic 72.5% |
| Natives/Alaskans | 0.0 /100 | #302 | Tragic 72.4% |