Yaqui vs Nepalese In Labor Force | Age 35-44
COMPARE
Yaqui
Nepalese
In Labor Force | Age 35-44
In Labor Force | Age 35-44 Comparison
Yaqui
Nepalese
80.5%
IN LABOR FORCE | AGE 35-44
0.0/ 100
METRIC RATING
323rd/ 347
METRIC RANK
82.4%
IN LABOR FORCE | AGE 35-44
0.0/ 100
METRIC RATING
303rd/ 347
METRIC RANK
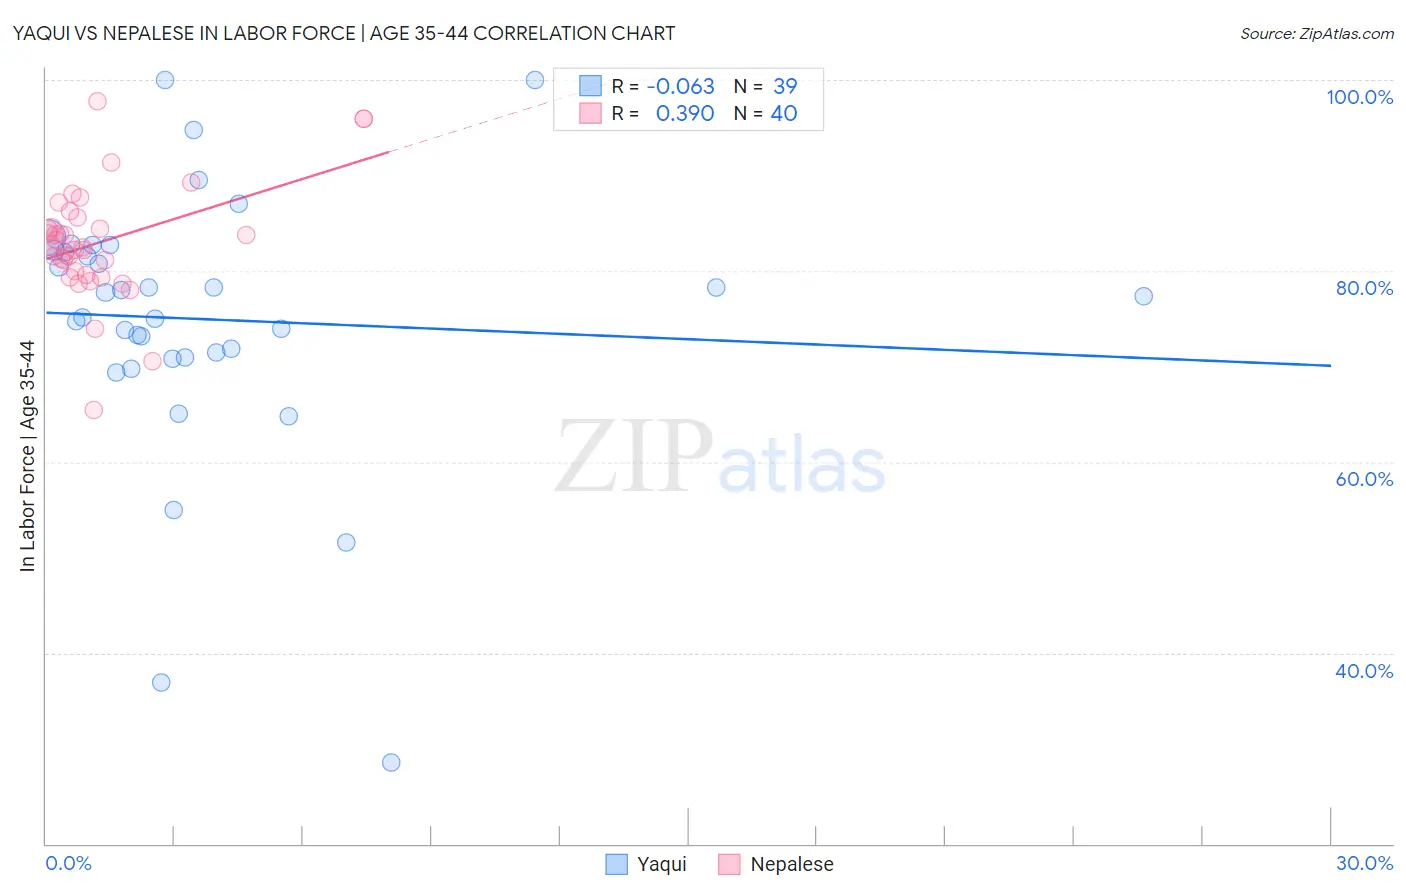
Yaqui vs Nepalese In Labor Force | Age 35-44 Correlation Chart
The statistical analysis conducted on geographies consisting of 107,720,131 people shows a slight negative correlation between the proportion of Yaqui and labor force participation rate among population between the ages 35 and 44 in the United States with a correlation coefficient (R) of -0.063 and weighted average of 80.5%. Similarly, the statistical analysis conducted on geographies consisting of 24,521,755 people shows a mild positive correlation between the proportion of Nepalese and labor force participation rate among population between the ages 35 and 44 in the United States with a correlation coefficient (R) of 0.390 and weighted average of 82.4%, a difference of 2.3%.
In Labor Force | Age 35-44 Correlation Summary
| Measurement | Yaqui | Nepalese |
| Minimum | 28.5% | 65.4% |
| Maximum | 100.0% | 97.8% |
| Range | 71.5% | 32.4% |
| Mean | 74.9% | 83.0% |
| Median | 77.3% | 82.5% |
| Interquartile 25% (IQ1) | 70.9% | 79.8% |
| Interquartile 75% (IQ3) | 82.2% | 85.1% |
| Interquartile Range (IQR) | 11.3% | 5.3% |
| Standard Deviation (Sample) | 14.0% | 6.1% |
| Standard Deviation (Population) | 13.8% | 6.0% |
Demographics Similar to Yaqui and Nepalese by In Labor Force | Age 35-44
In terms of in labor force | age 35-44, the demographic groups most similar to Yaqui are Paiute (80.6%, a difference of 0.11%), Puerto Rican (80.7%, a difference of 0.18%), Chickasaw (80.9%, a difference of 0.46%), Inupiat (80.9%, a difference of 0.51%), and Alaskan Athabascan (81.3%, a difference of 0.95%). Similarly, the demographic groups most similar to Nepalese are Marshallese (82.4%, a difference of 0.010%), Shoshone (82.2%, a difference of 0.28%), Black/African American (82.2%, a difference of 0.30%), Hispanic or Latino (82.1%, a difference of 0.39%), and Immigrants from Central America (82.0%, a difference of 0.55%).
| Demographics | Rating | Rank | In Labor Force | Age 35-44 |
| Nepalese | 0.0 /100 | #303 | Tragic 82.4% |
| Marshallese | 0.0 /100 | #304 | Tragic 82.4% |
| Shoshone | 0.0 /100 | #305 | Tragic 82.2% |
| Blacks/African Americans | 0.0 /100 | #306 | Tragic 82.2% |
| Hispanics or Latinos | 0.0 /100 | #307 | Tragic 82.1% |
| Immigrants | Central America | 0.0 /100 | #308 | Tragic 82.0% |
| Cree | 0.0 /100 | #309 | Tragic 82.0% |
| Blackfeet | 0.0 /100 | #310 | Tragic 81.9% |
| Colville | 0.0 /100 | #311 | Tragic 81.7% |
| Alaska Natives | 0.0 /100 | #312 | Tragic 81.6% |
| Mexicans | 0.0 /100 | #313 | Tragic 81.6% |
| Cajuns | 0.0 /100 | #314 | Tragic 81.5% |
| Immigrants | Mexico | 0.0 /100 | #315 | Tragic 81.5% |
| Comanche | 0.0 /100 | #316 | Tragic 81.5% |
| Cherokee | 0.0 /100 | #317 | Tragic 81.4% |
| Alaskan Athabascans | 0.0 /100 | #318 | Tragic 81.3% |
| Inupiat | 0.0 /100 | #319 | Tragic 80.9% |
| Chickasaw | 0.0 /100 | #320 | Tragic 80.9% |
| Puerto Ricans | 0.0 /100 | #321 | Tragic 80.7% |
| Paiute | 0.0 /100 | #322 | Tragic 80.6% |
| Yaqui | 0.0 /100 | #323 | Tragic 80.5% |