Immigrants from Bulgaria vs Aleut In Labor Force | Age 20-64
COMPARE
Immigrants from Bulgaria
Aleut
In Labor Force | Age 20-64
In Labor Force | Age 20-64 Comparison
Immigrants from Bulgaria
Aleuts
81.0%
IN LABOR FORCE | AGE 20-64
100.0/ 100
METRIC RATING
18th/ 347
METRIC RANK
78.2%
IN LABOR FORCE | AGE 20-64
0.0/ 100
METRIC RATING
274th/ 347
METRIC RANK
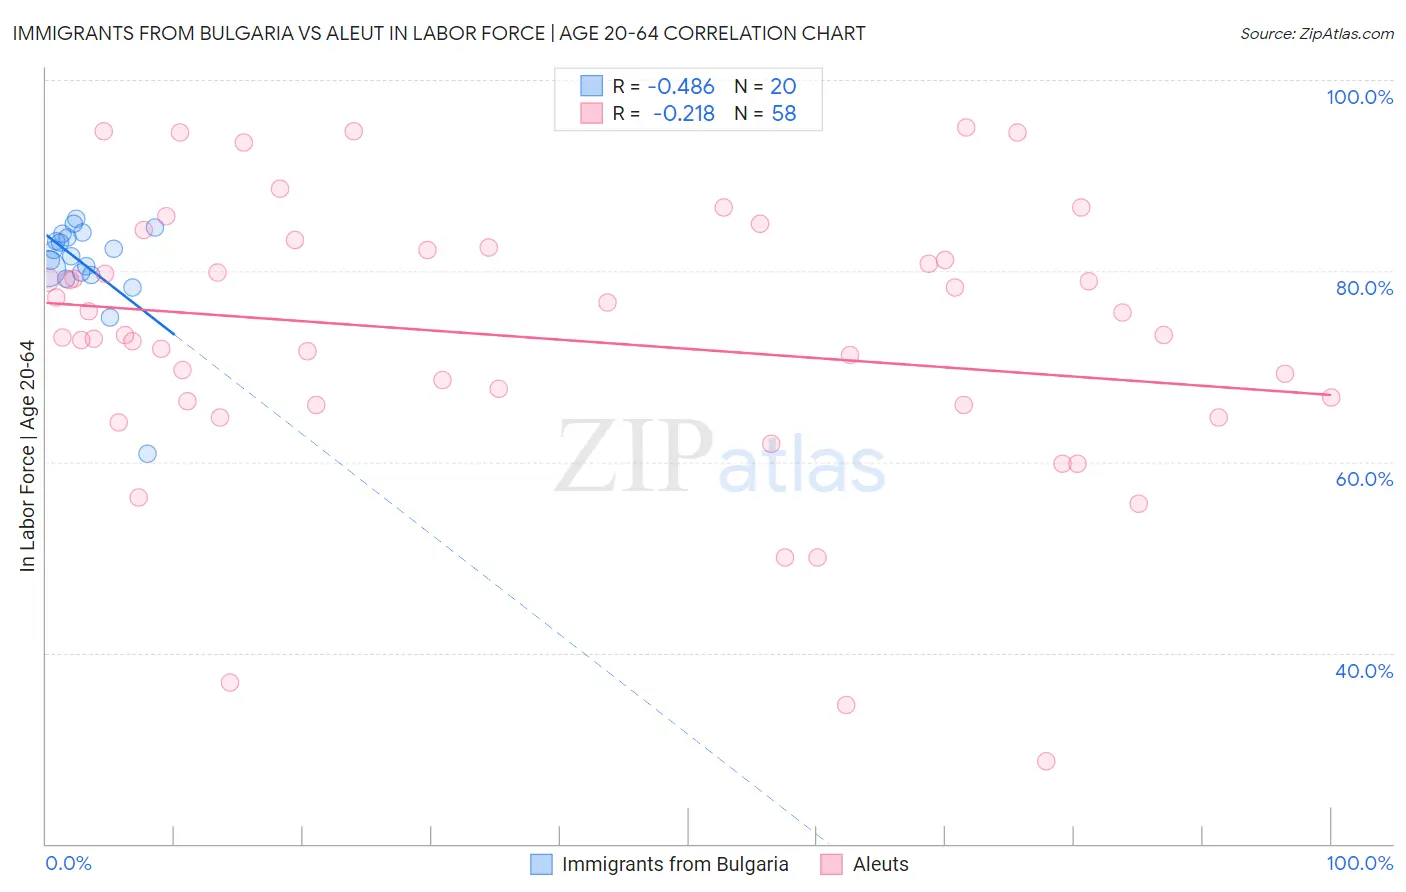
Immigrants from Bulgaria vs Aleut In Labor Force | Age 20-64 Correlation Chart
The statistical analysis conducted on geographies consisting of 172,551,746 people shows a moderate negative correlation between the proportion of Immigrants from Bulgaria and labor force participation rate among population between the ages 20 and 64 in the United States with a correlation coefficient (R) of -0.486 and weighted average of 81.0%. Similarly, the statistical analysis conducted on geographies consisting of 61,782,784 people shows a weak negative correlation between the proportion of Aleuts and labor force participation rate among population between the ages 20 and 64 in the United States with a correlation coefficient (R) of -0.218 and weighted average of 78.2%, a difference of 3.5%.
In Labor Force | Age 20-64 Correlation Summary
| Measurement | Immigrants from Bulgaria | Aleut |
| Minimum | 60.8% | 28.6% |
| Maximum | 85.5% | 95.0% |
| Range | 24.7% | 66.4% |
| Mean | 80.7% | 73.0% |
| Median | 81.9% | 73.3% |
| Interquartile 25% (IQ1) | 79.7% | 66.0% |
| Interquartile 75% (IQ3) | 83.7% | 82.2% |
| Interquartile Range (IQR) | 4.0% | 16.2% |
| Standard Deviation (Sample) | 5.3% | 14.4% |
| Standard Deviation (Population) | 5.2% | 14.3% |
Similar Demographics by In Labor Force | Age 20-64
Demographics Similar to Immigrants from Bulgaria by In Labor Force | Age 20-64
In terms of in labor force | age 20-64, the demographic groups most similar to Immigrants from Bulgaria are Zimbabwean (81.0%, a difference of 0.0%), Norwegian (81.0%, a difference of 0.010%), Thai (80.9%, a difference of 0.060%), Liberian (80.9%, a difference of 0.070%), and Bulgarian (81.1%, a difference of 0.12%).
| Demographics | Rating | Rank | In Labor Force | Age 20-64 |
| Immigrants | Eastern Africa | 100.0 /100 | #11 | Exceptional 81.3% |
| Immigrants | Eritrea | 100.0 /100 | #12 | Exceptional 81.3% |
| Immigrants | India | 100.0 /100 | #13 | Exceptional 81.3% |
| Cambodians | 100.0 /100 | #14 | Exceptional 81.1% |
| Bulgarians | 100.0 /100 | #15 | Exceptional 81.1% |
| Immigrants | Nepal | 100.0 /100 | #16 | Exceptional 81.1% |
| Norwegians | 100.0 /100 | #17 | Exceptional 81.0% |
| Immigrants | Bulgaria | 100.0 /100 | #18 | Exceptional 81.0% |
| Zimbabweans | 100.0 /100 | #19 | Exceptional 81.0% |
| Thais | 100.0 /100 | #20 | Exceptional 80.9% |
| Liberians | 100.0 /100 | #21 | Exceptional 80.9% |
| Sudanese | 100.0 /100 | #22 | Exceptional 80.8% |
| Immigrants | Bosnia and Herzegovina | 100.0 /100 | #23 | Exceptional 80.8% |
| Immigrants | Morocco | 100.0 /100 | #24 | Exceptional 80.8% |
| Kenyans | 100.0 /100 | #25 | Exceptional 80.8% |
Demographics Similar to Aleuts by In Labor Force | Age 20-64
In terms of in labor force | age 20-64, the demographic groups most similar to Aleuts are Spanish (78.2%, a difference of 0.010%), Puget Sound Salish (78.2%, a difference of 0.010%), French American Indian (78.2%, a difference of 0.020%), Immigrants from Bahamas (78.2%, a difference of 0.020%), and Mexican American Indian (78.2%, a difference of 0.030%).
| Demographics | Rating | Rank | In Labor Force | Age 20-64 |
| U.S. Virgin Islanders | 0.1 /100 | #267 | Tragic 78.4% |
| West Indians | 0.0 /100 | #268 | Tragic 78.3% |
| Immigrants | Barbados | 0.0 /100 | #269 | Tragic 78.3% |
| Scotch-Irish | 0.0 /100 | #270 | Tragic 78.3% |
| Immigrants | Latin America | 0.0 /100 | #271 | Tragic 78.3% |
| Marshallese | 0.0 /100 | #272 | Tragic 78.3% |
| French American Indians | 0.0 /100 | #273 | Tragic 78.2% |
| Aleuts | 0.0 /100 | #274 | Tragic 78.2% |
| Spanish | 0.0 /100 | #275 | Tragic 78.2% |
| Puget Sound Salish | 0.0 /100 | #276 | Tragic 78.2% |
| Immigrants | Bahamas | 0.0 /100 | #277 | Tragic 78.2% |
| Mexican American Indians | 0.0 /100 | #278 | Tragic 78.2% |
| Belizeans | 0.0 /100 | #279 | Tragic 78.2% |
| Immigrants | Dominica | 0.0 /100 | #280 | Tragic 78.1% |
| Guyanese | 0.0 /100 | #281 | Tragic 78.1% |