Immigrants from Bolivia vs Aleut In Labor Force | Age 20-64
COMPARE
Immigrants from Bolivia
Aleut
In Labor Force | Age 20-64
In Labor Force | Age 20-64 Comparison
Immigrants from Bolivia
Aleuts
81.9%
IN LABOR FORCE | AGE 20-64
100.0/ 100
METRIC RATING
3rd/ 347
METRIC RANK
78.2%
IN LABOR FORCE | AGE 20-64
0.0/ 100
METRIC RATING
274th/ 347
METRIC RANK
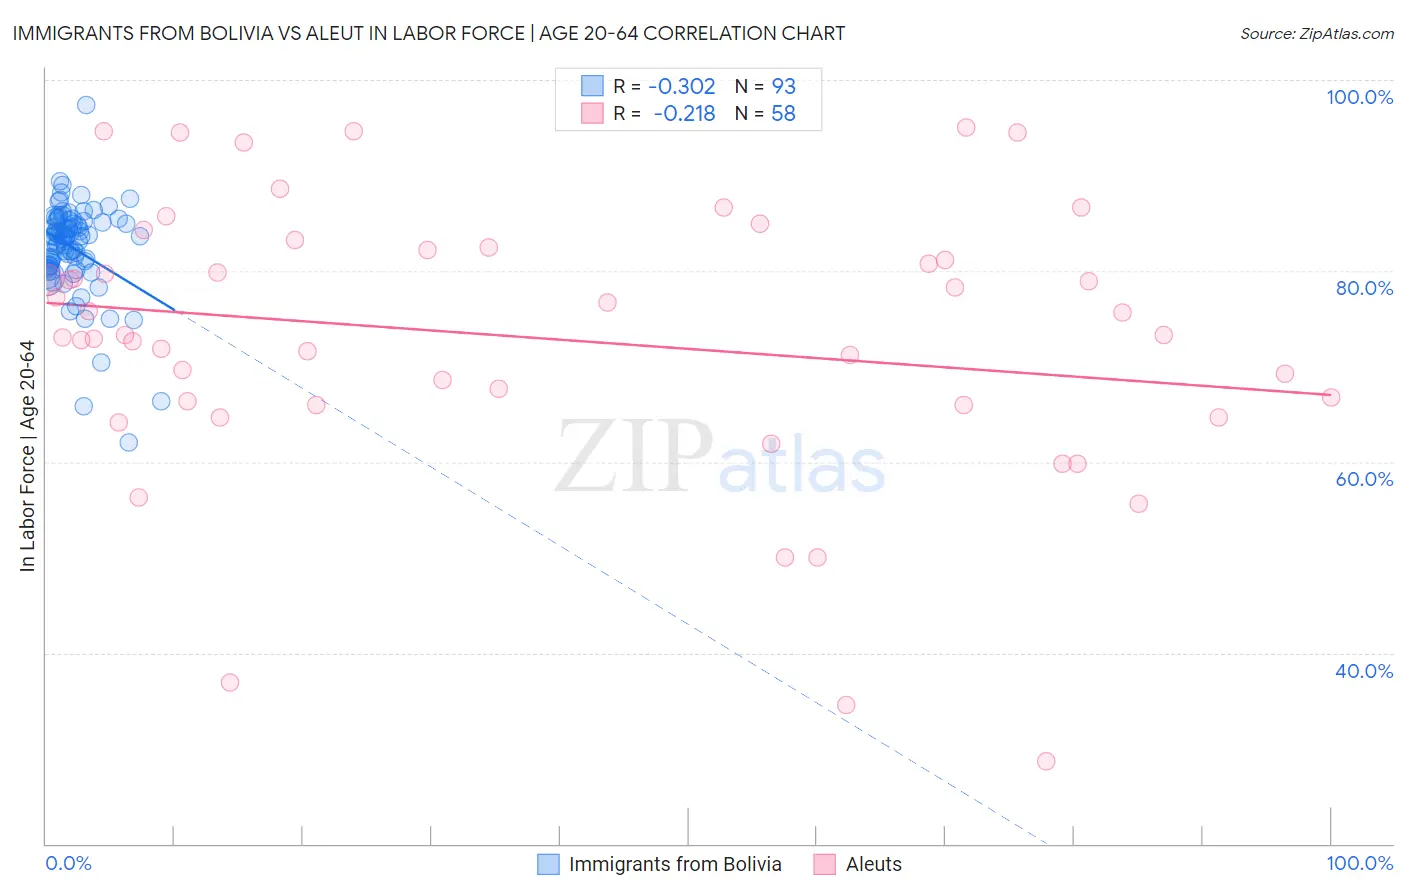
Immigrants from Bolivia vs Aleut In Labor Force | Age 20-64 Correlation Chart
The statistical analysis conducted on geographies consisting of 158,729,353 people shows a mild negative correlation between the proportion of Immigrants from Bolivia and labor force participation rate among population between the ages 20 and 64 in the United States with a correlation coefficient (R) of -0.302 and weighted average of 81.9%. Similarly, the statistical analysis conducted on geographies consisting of 61,782,784 people shows a weak negative correlation between the proportion of Aleuts and labor force participation rate among population between the ages 20 and 64 in the United States with a correlation coefficient (R) of -0.218 and weighted average of 78.2%, a difference of 4.8%.
In Labor Force | Age 20-64 Correlation Summary
| Measurement | Immigrants from Bolivia | Aleut |
| Minimum | 62.0% | 28.6% |
| Maximum | 97.4% | 95.0% |
| Range | 35.4% | 66.4% |
| Mean | 82.4% | 73.0% |
| Median | 83.6% | 73.3% |
| Interquartile 25% (IQ1) | 80.6% | 66.0% |
| Interquartile 75% (IQ3) | 85.2% | 82.2% |
| Interquartile Range (IQR) | 4.6% | 16.2% |
| Standard Deviation (Sample) | 4.9% | 14.4% |
| Standard Deviation (Population) | 4.9% | 14.3% |
Similar Demographics by In Labor Force | Age 20-64
Demographics Similar to Immigrants from Bolivia by In Labor Force | Age 20-64
In terms of in labor force | age 20-64, the demographic groups most similar to Immigrants from Bolivia are Ethiopian (82.0%, a difference of 0.020%), Luxembourger (81.9%, a difference of 0.12%), Immigrants from Ethiopia (82.1%, a difference of 0.13%), Bolivian (81.7%, a difference of 0.32%), and Somali (81.6%, a difference of 0.42%).
| Demographics | Rating | Rank | In Labor Force | Age 20-64 |
| Immigrants | Ethiopia | 100.0 /100 | #1 | Exceptional 82.1% |
| Ethiopians | 100.0 /100 | #2 | Exceptional 82.0% |
| Immigrants | Bolivia | 100.0 /100 | #3 | Exceptional 81.9% |
| Luxembourgers | 100.0 /100 | #4 | Exceptional 81.9% |
| Bolivians | 100.0 /100 | #5 | Exceptional 81.7% |
| Somalis | 100.0 /100 | #6 | Exceptional 81.6% |
| Immigrants | Cameroon | 100.0 /100 | #7 | Exceptional 81.6% |
| Immigrants | Somalia | 100.0 /100 | #8 | Exceptional 81.6% |
| Sierra Leoneans | 100.0 /100 | #9 | Exceptional 81.5% |
| Immigrants | Sierra Leone | 100.0 /100 | #10 | Exceptional 81.5% |
| Immigrants | Eastern Africa | 100.0 /100 | #11 | Exceptional 81.3% |
| Immigrants | Eritrea | 100.0 /100 | #12 | Exceptional 81.3% |
| Immigrants | India | 100.0 /100 | #13 | Exceptional 81.3% |
| Cambodians | 100.0 /100 | #14 | Exceptional 81.1% |
| Bulgarians | 100.0 /100 | #15 | Exceptional 81.1% |
Demographics Similar to Aleuts by In Labor Force | Age 20-64
In terms of in labor force | age 20-64, the demographic groups most similar to Aleuts are Spanish (78.2%, a difference of 0.010%), Puget Sound Salish (78.2%, a difference of 0.010%), French American Indian (78.2%, a difference of 0.020%), Immigrants from Bahamas (78.2%, a difference of 0.020%), and Mexican American Indian (78.2%, a difference of 0.030%).
| Demographics | Rating | Rank | In Labor Force | Age 20-64 |
| U.S. Virgin Islanders | 0.1 /100 | #267 | Tragic 78.4% |
| West Indians | 0.0 /100 | #268 | Tragic 78.3% |
| Immigrants | Barbados | 0.0 /100 | #269 | Tragic 78.3% |
| Scotch-Irish | 0.0 /100 | #270 | Tragic 78.3% |
| Immigrants | Latin America | 0.0 /100 | #271 | Tragic 78.3% |
| Marshallese | 0.0 /100 | #272 | Tragic 78.3% |
| French American Indians | 0.0 /100 | #273 | Tragic 78.2% |
| Aleuts | 0.0 /100 | #274 | Tragic 78.2% |
| Spanish | 0.0 /100 | #275 | Tragic 78.2% |
| Puget Sound Salish | 0.0 /100 | #276 | Tragic 78.2% |
| Immigrants | Bahamas | 0.0 /100 | #277 | Tragic 78.2% |
| Mexican American Indians | 0.0 /100 | #278 | Tragic 78.2% |
| Belizeans | 0.0 /100 | #279 | Tragic 78.2% |
| Immigrants | Dominica | 0.0 /100 | #280 | Tragic 78.1% |
| Guyanese | 0.0 /100 | #281 | Tragic 78.1% |