Malaysian vs Aleut In Labor Force | Age 20-64
COMPARE
Malaysian
Aleut
In Labor Force | Age 20-64
In Labor Force | Age 20-64 Comparison
Malaysians
Aleuts
79.5%
IN LABOR FORCE | AGE 20-64
37.1/ 100
METRIC RATING
182nd/ 347
METRIC RANK
78.2%
IN LABOR FORCE | AGE 20-64
0.0/ 100
METRIC RATING
274th/ 347
METRIC RANK
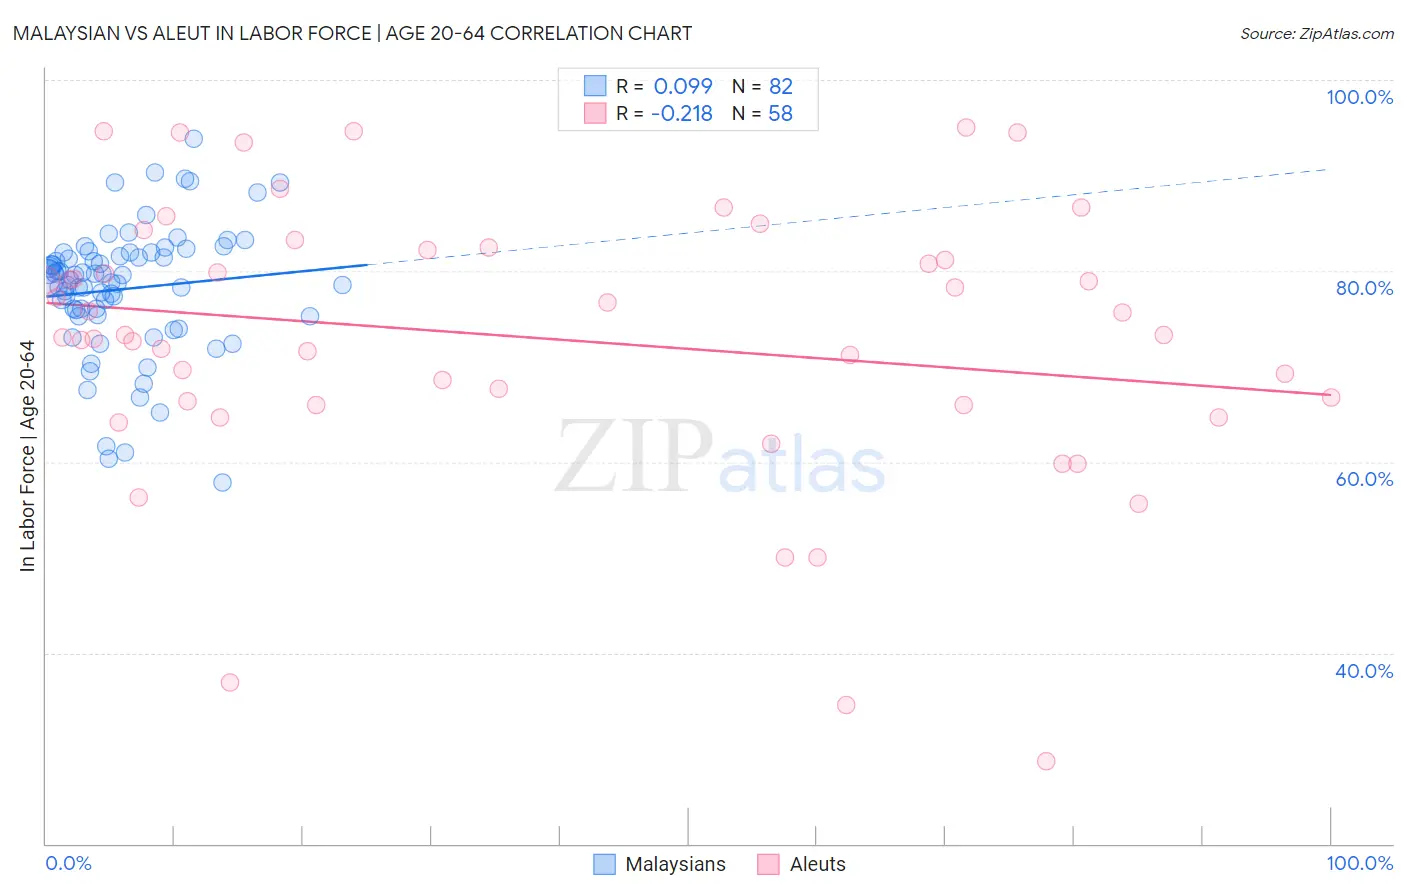
Malaysian vs Aleut In Labor Force | Age 20-64 Correlation Chart
The statistical analysis conducted on geographies consisting of 226,111,916 people shows a slight positive correlation between the proportion of Malaysians and labor force participation rate among population between the ages 20 and 64 in the United States with a correlation coefficient (R) of 0.099 and weighted average of 79.5%. Similarly, the statistical analysis conducted on geographies consisting of 61,782,784 people shows a weak negative correlation between the proportion of Aleuts and labor force participation rate among population between the ages 20 and 64 in the United States with a correlation coefficient (R) of -0.218 and weighted average of 78.2%, a difference of 1.6%.
In Labor Force | Age 20-64 Correlation Summary
| Measurement | Malaysian | Aleut |
| Minimum | 57.8% | 28.6% |
| Maximum | 93.8% | 95.0% |
| Range | 36.0% | 66.4% |
| Mean | 78.1% | 73.0% |
| Median | 79.2% | 73.3% |
| Interquartile 25% (IQ1) | 75.3% | 66.0% |
| Interquartile 75% (IQ3) | 81.9% | 82.2% |
| Interquartile Range (IQR) | 6.6% | 16.2% |
| Standard Deviation (Sample) | 6.8% | 14.4% |
| Standard Deviation (Population) | 6.7% | 14.3% |
Similar Demographics by In Labor Force | Age 20-64
Demographics Similar to Malaysians by In Labor Force | Age 20-64
In terms of in labor force | age 20-64, the demographic groups most similar to Malaysians are Immigrants from Hungary (79.5%, a difference of 0.0%), Immigrants from Saudi Arabia (79.5%, a difference of 0.010%), Finnish (79.5%, a difference of 0.010%), Israeli (79.5%, a difference of 0.020%), and Northern European (79.5%, a difference of 0.020%).
| Demographics | Rating | Rank | In Labor Force | Age 20-64 |
| Cubans | 46.1 /100 | #175 | Average 79.5% |
| Australians | 46.0 /100 | #176 | Average 79.5% |
| Immigrants | Netherlands | 45.2 /100 | #177 | Average 79.5% |
| Czechoslovakians | 44.3 /100 | #178 | Average 79.5% |
| Armenians | 41.4 /100 | #179 | Average 79.5% |
| Salvadorans | 41.0 /100 | #180 | Average 79.5% |
| Immigrants | Saudi Arabia | 37.7 /100 | #181 | Fair 79.5% |
| Malaysians | 37.1 /100 | #182 | Fair 79.5% |
| Immigrants | Hungary | 36.8 /100 | #183 | Fair 79.5% |
| Finns | 35.9 /100 | #184 | Fair 79.5% |
| Israelis | 34.7 /100 | #185 | Fair 79.5% |
| Northern Europeans | 34.5 /100 | #186 | Fair 79.5% |
| Assyrians/Chaldeans/Syriacs | 33.3 /100 | #187 | Fair 79.4% |
| Immigrants | Haiti | 32.1 /100 | #188 | Fair 79.4% |
| Immigrants | El Salvador | 30.9 /100 | #189 | Fair 79.4% |
Demographics Similar to Aleuts by In Labor Force | Age 20-64
In terms of in labor force | age 20-64, the demographic groups most similar to Aleuts are Spanish (78.2%, a difference of 0.010%), Puget Sound Salish (78.2%, a difference of 0.010%), French American Indian (78.2%, a difference of 0.020%), Immigrants from Bahamas (78.2%, a difference of 0.020%), and Mexican American Indian (78.2%, a difference of 0.030%).
| Demographics | Rating | Rank | In Labor Force | Age 20-64 |
| U.S. Virgin Islanders | 0.1 /100 | #267 | Tragic 78.4% |
| West Indians | 0.0 /100 | #268 | Tragic 78.3% |
| Immigrants | Barbados | 0.0 /100 | #269 | Tragic 78.3% |
| Scotch-Irish | 0.0 /100 | #270 | Tragic 78.3% |
| Immigrants | Latin America | 0.0 /100 | #271 | Tragic 78.3% |
| Marshallese | 0.0 /100 | #272 | Tragic 78.3% |
| French American Indians | 0.0 /100 | #273 | Tragic 78.2% |
| Aleuts | 0.0 /100 | #274 | Tragic 78.2% |
| Spanish | 0.0 /100 | #275 | Tragic 78.2% |
| Puget Sound Salish | 0.0 /100 | #276 | Tragic 78.2% |
| Immigrants | Bahamas | 0.0 /100 | #277 | Tragic 78.2% |
| Mexican American Indians | 0.0 /100 | #278 | Tragic 78.2% |
| Belizeans | 0.0 /100 | #279 | Tragic 78.2% |
| Immigrants | Dominica | 0.0 /100 | #280 | Tragic 78.1% |
| Guyanese | 0.0 /100 | #281 | Tragic 78.1% |