Immigrants from Middle Africa vs Aleut In Labor Force | Age 20-64
COMPARE
Immigrants from Middle Africa
Aleut
In Labor Force | Age 20-64
In Labor Force | Age 20-64 Comparison
Immigrants from Middle Africa
Aleuts
80.5%
IN LABOR FORCE | AGE 20-64
99.7/ 100
METRIC RATING
44th/ 347
METRIC RANK
78.2%
IN LABOR FORCE | AGE 20-64
0.0/ 100
METRIC RATING
274th/ 347
METRIC RANK
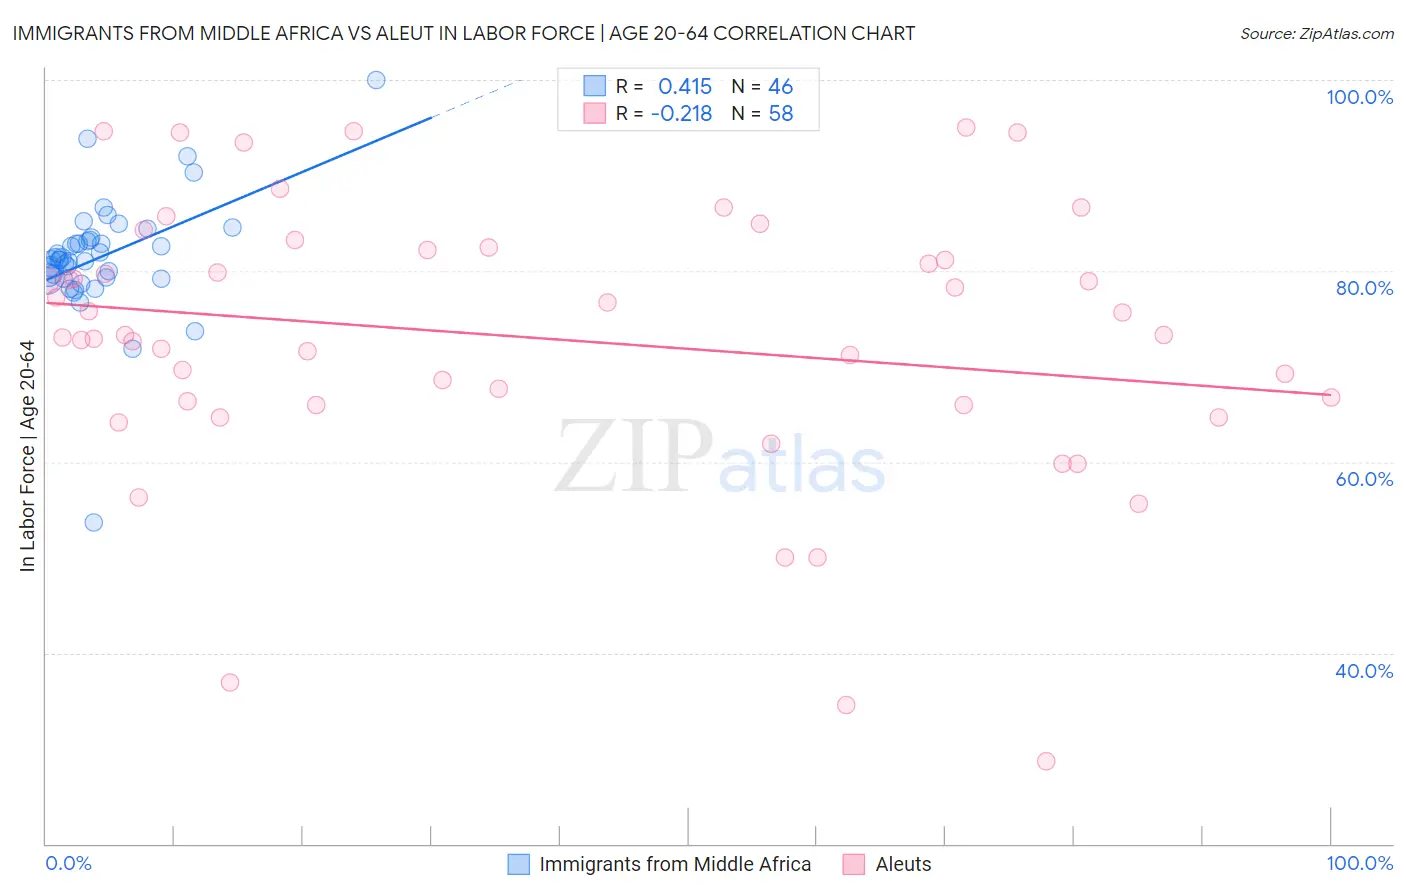
Immigrants from Middle Africa vs Aleut In Labor Force | Age 20-64 Correlation Chart
The statistical analysis conducted on geographies consisting of 202,739,694 people shows a moderate positive correlation between the proportion of Immigrants from Middle Africa and labor force participation rate among population between the ages 20 and 64 in the United States with a correlation coefficient (R) of 0.415 and weighted average of 80.5%. Similarly, the statistical analysis conducted on geographies consisting of 61,782,784 people shows a weak negative correlation between the proportion of Aleuts and labor force participation rate among population between the ages 20 and 64 in the United States with a correlation coefficient (R) of -0.218 and weighted average of 78.2%, a difference of 2.9%.
In Labor Force | Age 20-64 Correlation Summary
| Measurement | Immigrants from Middle Africa | Aleut |
| Minimum | 53.7% | 28.6% |
| Maximum | 100.0% | 95.0% |
| Range | 46.3% | 66.4% |
| Mean | 81.5% | 73.0% |
| Median | 81.2% | 73.3% |
| Interquartile 25% (IQ1) | 79.4% | 66.0% |
| Interquartile 75% (IQ3) | 83.3% | 82.2% |
| Interquartile Range (IQR) | 3.9% | 16.2% |
| Standard Deviation (Sample) | 6.4% | 14.4% |
| Standard Deviation (Population) | 6.3% | 14.3% |
Similar Demographics by In Labor Force | Age 20-64
Demographics Similar to Immigrants from Middle Africa by In Labor Force | Age 20-64
In terms of in labor force | age 20-64, the demographic groups most similar to Immigrants from Middle Africa are Slovene (80.5%, a difference of 0.020%), Czech (80.5%, a difference of 0.030%), Immigrants from Pakistan (80.5%, a difference of 0.030%), Latvian (80.5%, a difference of 0.040%), and Immigrants from Liberia (80.5%, a difference of 0.060%).
| Demographics | Rating | Rank | In Labor Force | Age 20-64 |
| Immigrants | Moldova | 99.8 /100 | #37 | Exceptional 80.6% |
| Ugandans | 99.8 /100 | #38 | Exceptional 80.6% |
| Brazilians | 99.8 /100 | #39 | Exceptional 80.5% |
| Immigrants | Zimbabwe | 99.8 /100 | #40 | Exceptional 80.5% |
| Immigrants | Liberia | 99.8 /100 | #41 | Exceptional 80.5% |
| Latvians | 99.8 /100 | #42 | Exceptional 80.5% |
| Czechs | 99.7 /100 | #43 | Exceptional 80.5% |
| Immigrants | Middle Africa | 99.7 /100 | #44 | Exceptional 80.5% |
| Slovenes | 99.7 /100 | #45 | Exceptional 80.5% |
| Immigrants | Pakistan | 99.6 /100 | #46 | Exceptional 80.5% |
| Immigrants | Africa | 99.6 /100 | #47 | Exceptional 80.4% |
| Immigrants | Hong Kong | 99.5 /100 | #48 | Exceptional 80.4% |
| Immigrants | Greece | 99.4 /100 | #49 | Exceptional 80.4% |
| Immigrants | Sudan | 99.4 /100 | #50 | Exceptional 80.4% |
| Immigrants | Sri Lanka | 99.3 /100 | #51 | Exceptional 80.4% |
Demographics Similar to Aleuts by In Labor Force | Age 20-64
In terms of in labor force | age 20-64, the demographic groups most similar to Aleuts are Spanish (78.2%, a difference of 0.010%), Puget Sound Salish (78.2%, a difference of 0.010%), French American Indian (78.2%, a difference of 0.020%), Immigrants from Bahamas (78.2%, a difference of 0.020%), and Mexican American Indian (78.2%, a difference of 0.030%).
| Demographics | Rating | Rank | In Labor Force | Age 20-64 |
| U.S. Virgin Islanders | 0.1 /100 | #267 | Tragic 78.4% |
| West Indians | 0.0 /100 | #268 | Tragic 78.3% |
| Immigrants | Barbados | 0.0 /100 | #269 | Tragic 78.3% |
| Scotch-Irish | 0.0 /100 | #270 | Tragic 78.3% |
| Immigrants | Latin America | 0.0 /100 | #271 | Tragic 78.3% |
| Marshallese | 0.0 /100 | #272 | Tragic 78.3% |
| French American Indians | 0.0 /100 | #273 | Tragic 78.2% |
| Aleuts | 0.0 /100 | #274 | Tragic 78.2% |
| Spanish | 0.0 /100 | #275 | Tragic 78.2% |
| Puget Sound Salish | 0.0 /100 | #276 | Tragic 78.2% |
| Immigrants | Bahamas | 0.0 /100 | #277 | Tragic 78.2% |
| Mexican American Indians | 0.0 /100 | #278 | Tragic 78.2% |
| Belizeans | 0.0 /100 | #279 | Tragic 78.2% |
| Immigrants | Dominica | 0.0 /100 | #280 | Tragic 78.1% |
| Guyanese | 0.0 /100 | #281 | Tragic 78.1% |