Spanish American vs Argentinean In Labor Force | Age 45-54
COMPARE
Spanish American
Argentinean
In Labor Force | Age 45-54
In Labor Force | Age 45-54 Comparison
Spanish Americans
Argentineans
80.1%
IN LABOR FORCE | AGE 45-54
0.0/ 100
METRIC RATING
306th/ 347
METRIC RANK
83.3%
IN LABOR FORCE | AGE 45-54
94.9/ 100
METRIC RATING
94th/ 347
METRIC RANK
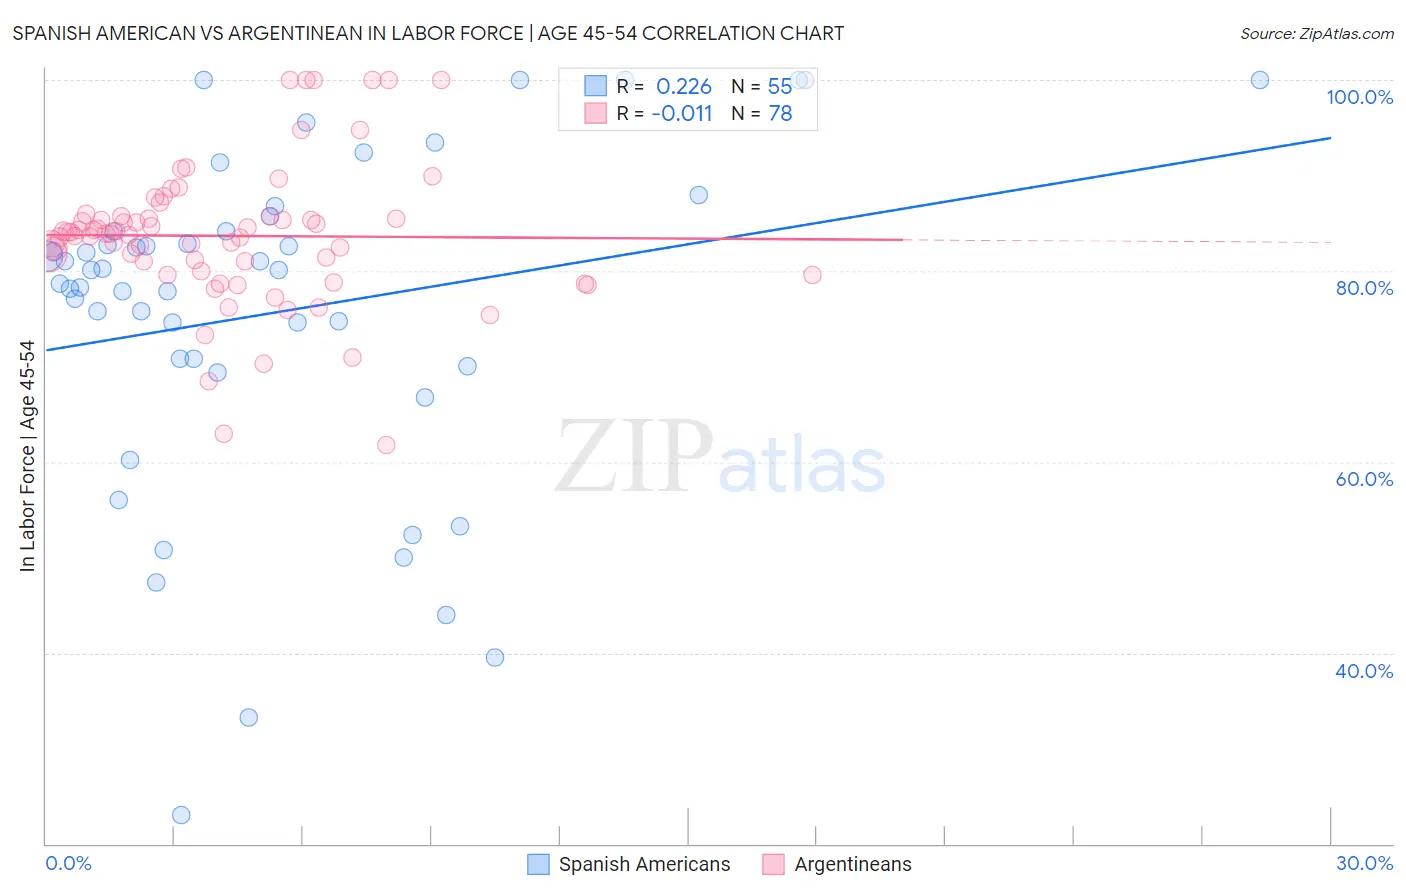
Spanish American vs Argentinean In Labor Force | Age 45-54 Correlation Chart
The statistical analysis conducted on geographies consisting of 103,159,967 people shows a weak positive correlation between the proportion of Spanish Americans and labor force participation rate among population between the ages 45 and 54 in the United States with a correlation coefficient (R) of 0.226 and weighted average of 80.1%. Similarly, the statistical analysis conducted on geographies consisting of 296,984,217 people shows no correlation between the proportion of Argentineans and labor force participation rate among population between the ages 45 and 54 in the United States with a correlation coefficient (R) of -0.011 and weighted average of 83.3%, a difference of 4.0%.
In Labor Force | Age 45-54 Correlation Summary
| Measurement | Spanish American | Argentinean |
| Minimum | 23.0% | 61.8% |
| Maximum | 100.0% | 100.0% |
| Range | 77.0% | 38.2% |
| Mean | 75.7% | 83.7% |
| Median | 80.1% | 83.9% |
| Interquartile 25% (IQ1) | 70.0% | 80.0% |
| Interquartile 75% (IQ3) | 84.1% | 85.7% |
| Interquartile Range (IQR) | 14.1% | 5.8% |
| Standard Deviation (Sample) | 17.6% | 7.4% |
| Standard Deviation (Population) | 17.4% | 7.4% |
Similar Demographics by In Labor Force | Age 45-54
Demographics Similar to Spanish Americans by In Labor Force | Age 45-54
In terms of in labor force | age 45-54, the demographic groups most similar to Spanish Americans are Immigrants from Dominican Republic (80.1%, a difference of 0.040%), Hispanic or Latino (80.1%, a difference of 0.050%), Immigrants from the Azores (80.1%, a difference of 0.070%), Blackfeet (80.0%, a difference of 0.080%), and Central American Indian (80.0%, a difference of 0.12%).
| Demographics | Rating | Rank | In Labor Force | Age 45-54 |
| Dominicans | 0.0 /100 | #299 | Tragic 80.3% |
| Fijians | 0.0 /100 | #300 | Tragic 80.2% |
| Spanish American Indians | 0.0 /100 | #301 | Tragic 80.2% |
| Immigrants | Central America | 0.0 /100 | #302 | Tragic 80.2% |
| Immigrants | Azores | 0.0 /100 | #303 | Tragic 80.1% |
| Hispanics or Latinos | 0.0 /100 | #304 | Tragic 80.1% |
| Immigrants | Dominican Republic | 0.0 /100 | #305 | Tragic 80.1% |
| Spanish Americans | 0.0 /100 | #306 | Tragic 80.1% |
| Blackfeet | 0.0 /100 | #307 | Tragic 80.0% |
| Central American Indians | 0.0 /100 | #308 | Tragic 80.0% |
| Potawatomi | 0.0 /100 | #309 | Tragic 80.0% |
| Inupiat | 0.0 /100 | #310 | Tragic 79.9% |
| Mexicans | 0.0 /100 | #311 | Tragic 79.8% |
| Immigrants | Mexico | 0.0 /100 | #312 | Tragic 79.7% |
| Colville | 0.0 /100 | #313 | Tragic 79.5% |
Demographics Similar to Argentineans by In Labor Force | Age 45-54
In terms of in labor force | age 45-54, the demographic groups most similar to Argentineans are Immigrants from Argentina (83.3%, a difference of 0.0%), Italian (83.3%, a difference of 0.010%), Immigrants from Kuwait (83.3%, a difference of 0.010%), Palestinian (83.3%, a difference of 0.010%), and Danish (83.3%, a difference of 0.020%).
| Demographics | Rating | Rank | In Labor Force | Age 45-54 |
| Immigrants | Eastern Europe | 95.6 /100 | #87 | Exceptional 83.3% |
| Immigrants | Asia | 95.6 /100 | #88 | Exceptional 83.3% |
| Indians (Asian) | 95.5 /100 | #89 | Exceptional 83.3% |
| Immigrants | Japan | 95.5 /100 | #90 | Exceptional 83.3% |
| South Americans | 95.5 /100 | #91 | Exceptional 83.3% |
| Danes | 95.3 /100 | #92 | Exceptional 83.3% |
| Italians | 95.1 /100 | #93 | Exceptional 83.3% |
| Argentineans | 94.9 /100 | #94 | Exceptional 83.3% |
| Immigrants | Argentina | 94.9 /100 | #95 | Exceptional 83.3% |
| Immigrants | Kuwait | 94.8 /100 | #96 | Exceptional 83.3% |
| Palestinians | 94.8 /100 | #97 | Exceptional 83.3% |
| Maltese | 94.4 /100 | #98 | Exceptional 83.3% |
| Immigrants | Middle Africa | 94.3 /100 | #99 | Exceptional 83.3% |
| Mongolians | 94.2 /100 | #100 | Exceptional 83.3% |
| Immigrants | Belarus | 94.1 /100 | #101 | Exceptional 83.3% |