Spanish American vs Immigrants from Northern Europe In Labor Force | Age 45-54
COMPARE
Spanish American
Immigrants from Northern Europe
In Labor Force | Age 45-54
In Labor Force | Age 45-54 Comparison
Spanish Americans
Immigrants from Northern Europe
80.1%
IN LABOR FORCE | AGE 45-54
0.0/ 100
METRIC RATING
306th/ 347
METRIC RANK
83.1%
IN LABOR FORCE | AGE 45-54
85.1/ 100
METRIC RATING
129th/ 347
METRIC RANK
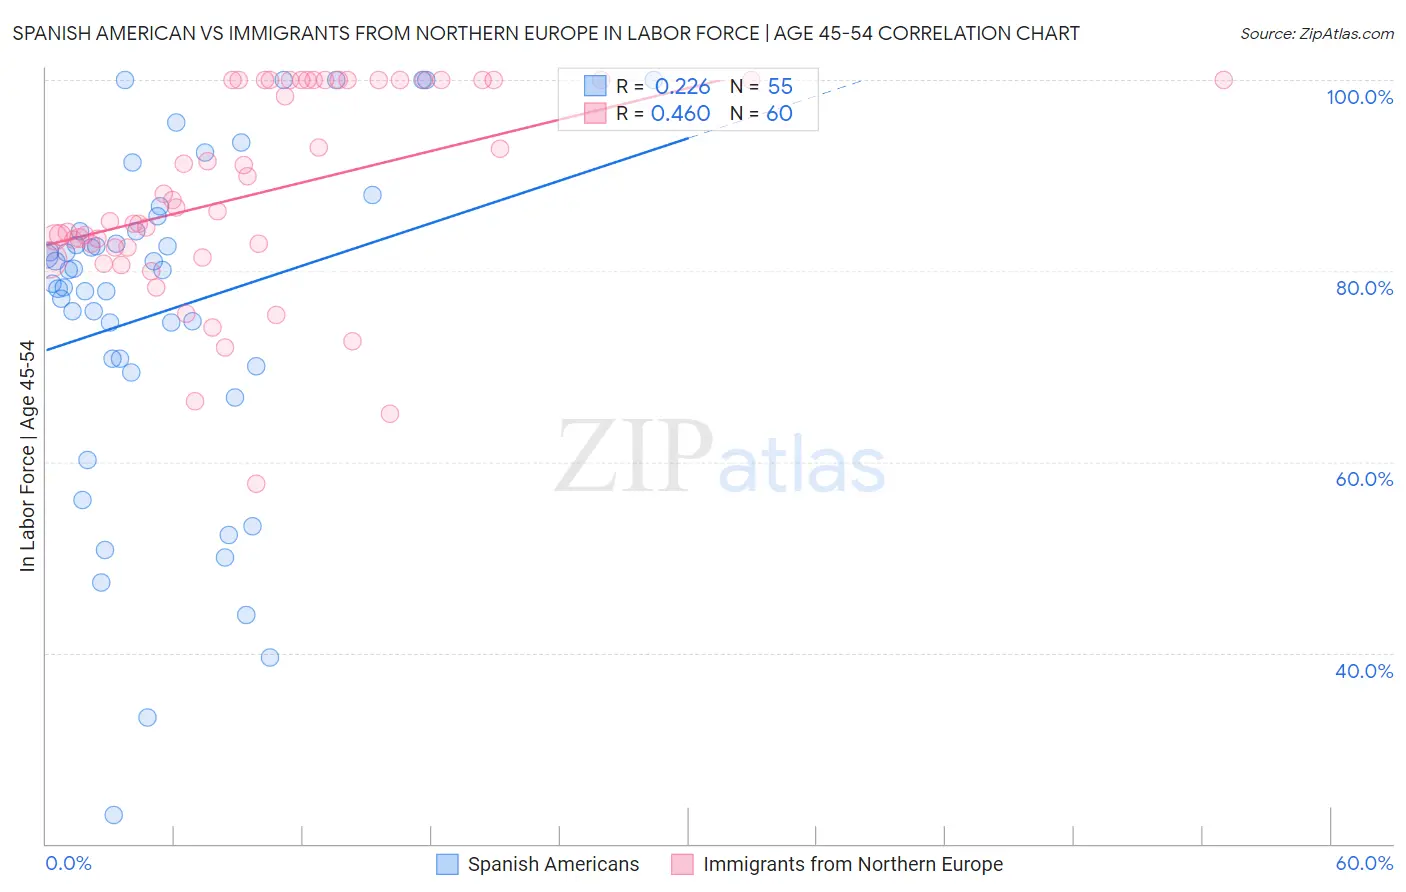
Spanish American vs Immigrants from Northern Europe In Labor Force | Age 45-54 Correlation Chart
The statistical analysis conducted on geographies consisting of 103,159,967 people shows a weak positive correlation between the proportion of Spanish Americans and labor force participation rate among population between the ages 45 and 54 in the United States with a correlation coefficient (R) of 0.226 and weighted average of 80.1%. Similarly, the statistical analysis conducted on geographies consisting of 476,905,263 people shows a moderate positive correlation between the proportion of Immigrants from Northern Europe and labor force participation rate among population between the ages 45 and 54 in the United States with a correlation coefficient (R) of 0.460 and weighted average of 83.1%, a difference of 3.8%.
In Labor Force | Age 45-54 Correlation Summary
| Measurement | Spanish American | Immigrants from Northern Europe |
| Minimum | 23.0% | 57.7% |
| Maximum | 100.0% | 100.0% |
| Range | 77.0% | 42.3% |
| Mean | 75.7% | 88.2% |
| Median | 80.1% | 86.5% |
| Interquartile 25% (IQ1) | 70.0% | 82.5% |
| Interquartile 75% (IQ3) | 84.1% | 100.0% |
| Interquartile Range (IQR) | 14.1% | 17.5% |
| Standard Deviation (Sample) | 17.6% | 10.6% |
| Standard Deviation (Population) | 17.4% | 10.5% |
Similar Demographics by In Labor Force | Age 45-54
Demographics Similar to Spanish Americans by In Labor Force | Age 45-54
In terms of in labor force | age 45-54, the demographic groups most similar to Spanish Americans are Immigrants from Dominican Republic (80.1%, a difference of 0.040%), Hispanic or Latino (80.1%, a difference of 0.050%), Immigrants from the Azores (80.1%, a difference of 0.070%), Blackfeet (80.0%, a difference of 0.080%), and Central American Indian (80.0%, a difference of 0.12%).
| Demographics | Rating | Rank | In Labor Force | Age 45-54 |
| Dominicans | 0.0 /100 | #299 | Tragic 80.3% |
| Fijians | 0.0 /100 | #300 | Tragic 80.2% |
| Spanish American Indians | 0.0 /100 | #301 | Tragic 80.2% |
| Immigrants | Central America | 0.0 /100 | #302 | Tragic 80.2% |
| Immigrants | Azores | 0.0 /100 | #303 | Tragic 80.1% |
| Hispanics or Latinos | 0.0 /100 | #304 | Tragic 80.1% |
| Immigrants | Dominican Republic | 0.0 /100 | #305 | Tragic 80.1% |
| Spanish Americans | 0.0 /100 | #306 | Tragic 80.1% |
| Blackfeet | 0.0 /100 | #307 | Tragic 80.0% |
| Central American Indians | 0.0 /100 | #308 | Tragic 80.0% |
| Potawatomi | 0.0 /100 | #309 | Tragic 80.0% |
| Inupiat | 0.0 /100 | #310 | Tragic 79.9% |
| Mexicans | 0.0 /100 | #311 | Tragic 79.8% |
| Immigrants | Mexico | 0.0 /100 | #312 | Tragic 79.7% |
| Colville | 0.0 /100 | #313 | Tragic 79.5% |
Demographics Similar to Immigrants from Northern Europe by In Labor Force | Age 45-54
In terms of in labor force | age 45-54, the demographic groups most similar to Immigrants from Northern Europe are Immigrants from Jordan (83.1%, a difference of 0.0%), German (83.1%, a difference of 0.0%), Immigrants from Israel (83.1%, a difference of 0.010%), Immigrants from Belgium (83.1%, a difference of 0.020%), and Finnish (83.1%, a difference of 0.030%).
| Demographics | Rating | Rank | In Labor Force | Age 45-54 |
| Immigrants | Vietnam | 88.9 /100 | #122 | Excellent 83.1% |
| Tongans | 88.2 /100 | #123 | Excellent 83.1% |
| Bermudans | 88.0 /100 | #124 | Excellent 83.1% |
| Immigrants | Iran | 87.2 /100 | #125 | Excellent 83.1% |
| Immigrants | Belgium | 86.4 /100 | #126 | Excellent 83.1% |
| Immigrants | Jordan | 85.2 /100 | #127 | Excellent 83.1% |
| Germans | 85.1 /100 | #128 | Excellent 83.1% |
| Immigrants | Northern Europe | 85.1 /100 | #129 | Excellent 83.1% |
| Immigrants | Israel | 84.7 /100 | #130 | Excellent 83.1% |
| Finns | 83.3 /100 | #131 | Excellent 83.1% |
| Immigrants | Ukraine | 82.9 /100 | #132 | Excellent 83.0% |
| Liberians | 82.7 /100 | #133 | Excellent 83.0% |
| Sudanese | 82.0 /100 | #134 | Excellent 83.0% |
| Austrians | 81.3 /100 | #135 | Excellent 83.0% |
| Immigrants | Kazakhstan | 81.0 /100 | #136 | Excellent 83.0% |