South American vs Immigrants from Belize In Labor Force | Age 30-34
COMPARE
South American
Immigrants from Belize
In Labor Force | Age 30-34
In Labor Force | Age 30-34 Comparison
South Americans
Immigrants from Belize
84.7%
IN LABOR FORCE | AGE 30-34
58.7/ 100
METRIC RATING
162nd/ 347
METRIC RANK
83.2%
IN LABOR FORCE | AGE 30-34
0.0/ 100
METRIC RATING
284th/ 347
METRIC RANK
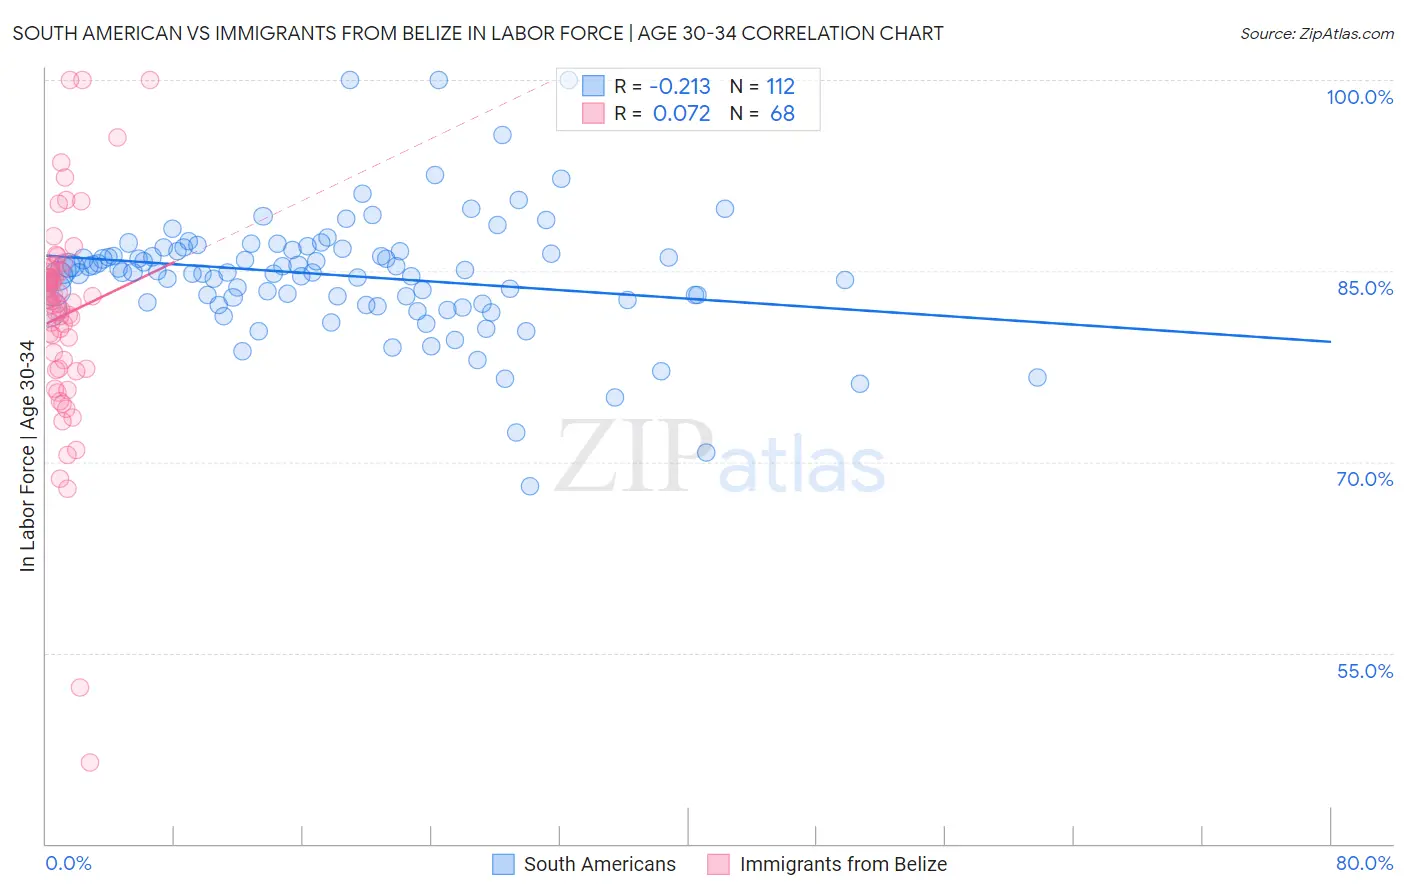
South American vs Immigrants from Belize In Labor Force | Age 30-34 Correlation Chart
The statistical analysis conducted on geographies consisting of 493,657,533 people shows a weak negative correlation between the proportion of South Americans and labor force participation rate among population between the ages 30 and 34 in the United States with a correlation coefficient (R) of -0.213 and weighted average of 84.7%. Similarly, the statistical analysis conducted on geographies consisting of 130,310,300 people shows a slight positive correlation between the proportion of Immigrants from Belize and labor force participation rate among population between the ages 30 and 34 in the United States with a correlation coefficient (R) of 0.072 and weighted average of 83.2%, a difference of 1.9%.
In Labor Force | Age 30-34 Correlation Summary
| Measurement | South American | Immigrants from Belize |
| Minimum | 68.1% | 46.4% |
| Maximum | 100.0% | 100.0% |
| Range | 31.9% | 53.6% |
| Mean | 84.6% | 81.5% |
| Median | 84.9% | 82.6% |
| Interquartile 25% (IQ1) | 82.5% | 77.3% |
| Interquartile 75% (IQ3) | 86.6% | 84.9% |
| Interquartile Range (IQR) | 4.1% | 7.6% |
| Standard Deviation (Sample) | 4.9% | 8.8% |
| Standard Deviation (Population) | 4.8% | 8.7% |
Similar Demographics by In Labor Force | Age 30-34
Demographics Similar to South Americans by In Labor Force | Age 30-34
In terms of in labor force | age 30-34, the demographic groups most similar to South Americans are Immigrants from Cambodia (84.7%, a difference of 0.010%), Immigrants from Uruguay (84.7%, a difference of 0.010%), Icelander (84.7%, a difference of 0.010%), Immigrants from Western Europe (84.7%, a difference of 0.010%), and Pakistani (84.7%, a difference of 0.020%).
| Demographics | Rating | Rank | In Labor Force | Age 30-34 |
| Immigrants | Sudan | 69.5 /100 | #155 | Good 84.8% |
| French Canadians | 67.3 /100 | #156 | Good 84.8% |
| Peruvians | 65.9 /100 | #157 | Good 84.8% |
| Immigrants | Armenia | 64.7 /100 | #158 | Good 84.8% |
| Czechoslovakians | 63.0 /100 | #159 | Good 84.8% |
| Pakistanis | 60.8 /100 | #160 | Good 84.7% |
| Immigrants | Cambodia | 60.7 /100 | #161 | Good 84.7% |
| South Americans | 58.7 /100 | #162 | Average 84.7% |
| Immigrants | Uruguay | 57.4 /100 | #163 | Average 84.7% |
| Icelanders | 56.8 /100 | #164 | Average 84.7% |
| Immigrants | Western Europe | 56.7 /100 | #165 | Average 84.7% |
| Afghans | 55.2 /100 | #166 | Average 84.7% |
| Immigrants | South Eastern Asia | 54.2 /100 | #167 | Average 84.7% |
| Immigrants | Peru | 52.4 /100 | #168 | Average 84.7% |
| South American Indians | 52.1 /100 | #169 | Average 84.7% |
Demographics Similar to Immigrants from Belize by In Labor Force | Age 30-34
In terms of in labor force | age 30-34, the demographic groups most similar to Immigrants from Belize are Cree (83.2%, a difference of 0.0%), Assyrian/Chaldean/Syriac (83.2%, a difference of 0.050%), Immigrants from Latin America (83.1%, a difference of 0.060%), Mexican American Indian (83.2%, a difference of 0.070%), and Samoan (83.3%, a difference of 0.10%).
| Demographics | Rating | Rank | In Labor Force | Age 30-34 |
| Delaware | 0.0 /100 | #277 | Tragic 83.5% |
| Fijians | 0.0 /100 | #278 | Tragic 83.4% |
| Immigrants | Fiji | 0.0 /100 | #279 | Tragic 83.4% |
| Africans | 0.0 /100 | #280 | Tragic 83.4% |
| Samoans | 0.0 /100 | #281 | Tragic 83.3% |
| Mexican American Indians | 0.0 /100 | #282 | Tragic 83.2% |
| Assyrians/Chaldeans/Syriacs | 0.0 /100 | #283 | Tragic 83.2% |
| Immigrants | Belize | 0.0 /100 | #284 | Tragic 83.2% |
| Cree | 0.0 /100 | #285 | Tragic 83.2% |
| Immigrants | Latin America | 0.0 /100 | #286 | Tragic 83.1% |
| Native Hawaiians | 0.0 /100 | #287 | Tragic 83.0% |
| Central American Indians | 0.0 /100 | #288 | Tragic 83.0% |
| Hawaiians | 0.0 /100 | #289 | Tragic 83.0% |
| Blackfeet | 0.0 /100 | #290 | Tragic 82.8% |
| Potawatomi | 0.0 /100 | #291 | Tragic 82.8% |