South American vs Immigrants from Hong Kong In Labor Force | Age 30-34
COMPARE
South American
Immigrants from Hong Kong
In Labor Force | Age 30-34
In Labor Force | Age 30-34 Comparison
South Americans
Immigrants from Hong Kong
84.7%
IN LABOR FORCE | AGE 30-34
58.7/ 100
METRIC RATING
162nd/ 347
METRIC RANK
85.8%
IN LABOR FORCE | AGE 30-34
100.0/ 100
METRIC RATING
30th/ 347
METRIC RANK
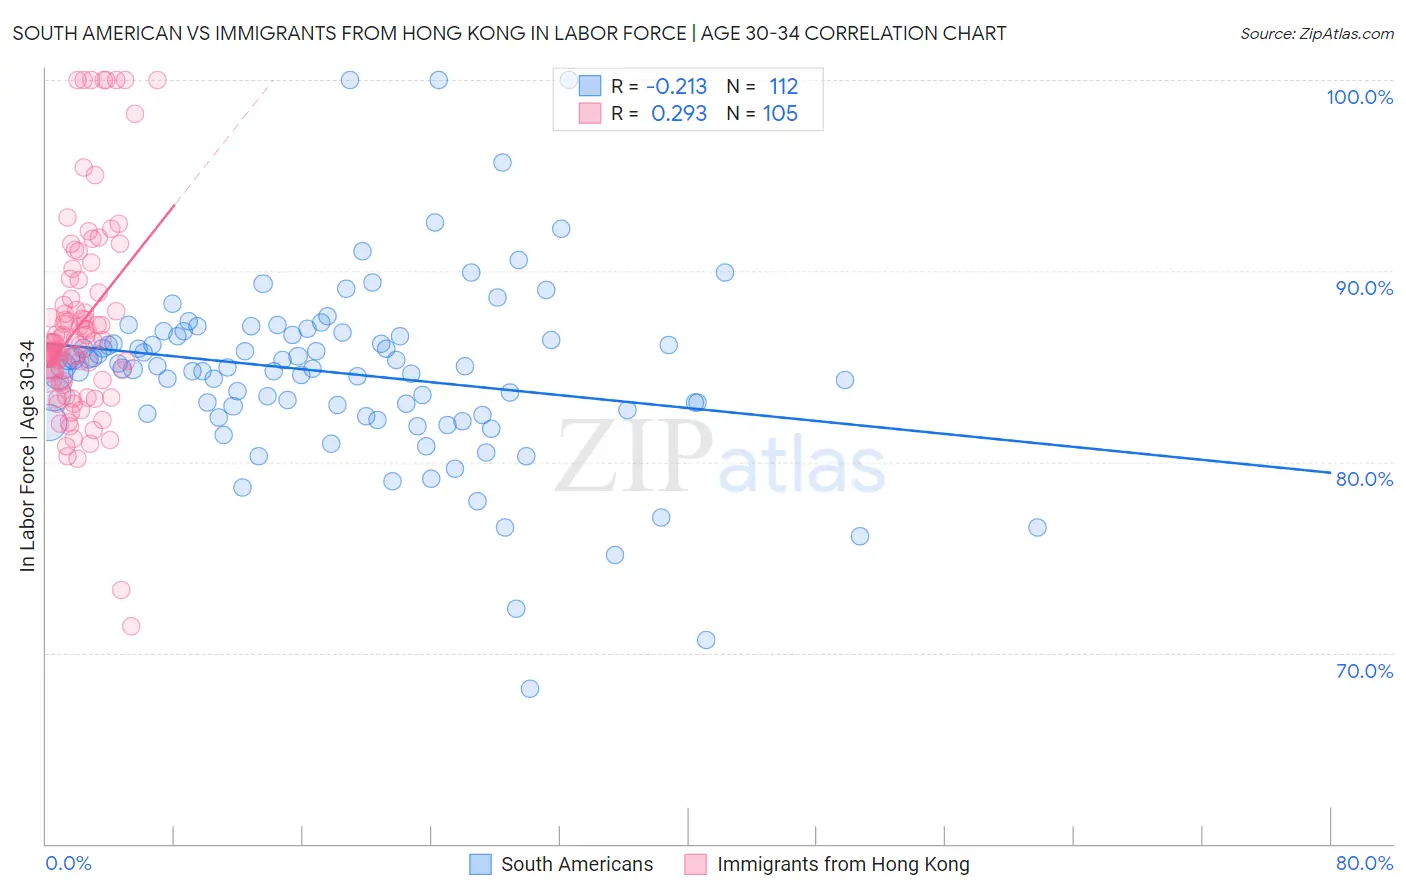
South American vs Immigrants from Hong Kong In Labor Force | Age 30-34 Correlation Chart
The statistical analysis conducted on geographies consisting of 493,657,533 people shows a weak negative correlation between the proportion of South Americans and labor force participation rate among population between the ages 30 and 34 in the United States with a correlation coefficient (R) of -0.213 and weighted average of 84.7%. Similarly, the statistical analysis conducted on geographies consisting of 253,906,280 people shows a weak positive correlation between the proportion of Immigrants from Hong Kong and labor force participation rate among population between the ages 30 and 34 in the United States with a correlation coefficient (R) of 0.293 and weighted average of 85.8%, a difference of 1.3%.
In Labor Force | Age 30-34 Correlation Summary
| Measurement | South American | Immigrants from Hong Kong |
| Minimum | 68.1% | 71.4% |
| Maximum | 100.0% | 100.0% |
| Range | 31.9% | 28.6% |
| Mean | 84.6% | 87.2% |
| Median | 84.9% | 86.2% |
| Interquartile 25% (IQ1) | 82.5% | 84.3% |
| Interquartile 75% (IQ3) | 86.6% | 88.7% |
| Interquartile Range (IQR) | 4.1% | 4.5% |
| Standard Deviation (Sample) | 4.9% | 5.3% |
| Standard Deviation (Population) | 4.8% | 5.3% |
Similar Demographics by In Labor Force | Age 30-34
Demographics Similar to South Americans by In Labor Force | Age 30-34
In terms of in labor force | age 30-34, the demographic groups most similar to South Americans are Immigrants from Cambodia (84.7%, a difference of 0.010%), Immigrants from Uruguay (84.7%, a difference of 0.010%), Icelander (84.7%, a difference of 0.010%), Immigrants from Western Europe (84.7%, a difference of 0.010%), and Pakistani (84.7%, a difference of 0.020%).
| Demographics | Rating | Rank | In Labor Force | Age 30-34 |
| Immigrants | Sudan | 69.5 /100 | #155 | Good 84.8% |
| French Canadians | 67.3 /100 | #156 | Good 84.8% |
| Peruvians | 65.9 /100 | #157 | Good 84.8% |
| Immigrants | Armenia | 64.7 /100 | #158 | Good 84.8% |
| Czechoslovakians | 63.0 /100 | #159 | Good 84.8% |
| Pakistanis | 60.8 /100 | #160 | Good 84.7% |
| Immigrants | Cambodia | 60.7 /100 | #161 | Good 84.7% |
| South Americans | 58.7 /100 | #162 | Average 84.7% |
| Immigrants | Uruguay | 57.4 /100 | #163 | Average 84.7% |
| Icelanders | 56.8 /100 | #164 | Average 84.7% |
| Immigrants | Western Europe | 56.7 /100 | #165 | Average 84.7% |
| Afghans | 55.2 /100 | #166 | Average 84.7% |
| Immigrants | South Eastern Asia | 54.2 /100 | #167 | Average 84.7% |
| Immigrants | Peru | 52.4 /100 | #168 | Average 84.7% |
| South American Indians | 52.1 /100 | #169 | Average 84.7% |
Demographics Similar to Immigrants from Hong Kong by In Labor Force | Age 30-34
In terms of in labor force | age 30-34, the demographic groups most similar to Immigrants from Hong Kong are Paraguayan (85.8%, a difference of 0.020%), Cypriot (85.8%, a difference of 0.020%), Tsimshian (85.8%, a difference of 0.040%), Immigrants from Latvia (85.9%, a difference of 0.060%), and Immigrants from Bosnia and Herzegovina (85.8%, a difference of 0.060%).
| Demographics | Rating | Rank | In Labor Force | Age 30-34 |
| Estonians | 100.0 /100 | #23 | Exceptional 85.9% |
| Immigrants | Eritrea | 100.0 /100 | #24 | Exceptional 85.9% |
| Immigrants | North Macedonia | 100.0 /100 | #25 | Exceptional 85.9% |
| Immigrants | Eastern Africa | 100.0 /100 | #26 | Exceptional 85.9% |
| Immigrants | Liberia | 100.0 /100 | #27 | Exceptional 85.9% |
| Immigrants | Latvia | 100.0 /100 | #28 | Exceptional 85.9% |
| Tsimshian | 100.0 /100 | #29 | Exceptional 85.8% |
| Immigrants | Hong Kong | 100.0 /100 | #30 | Exceptional 85.8% |
| Paraguayans | 99.9 /100 | #31 | Exceptional 85.8% |
| Cypriots | 99.9 /100 | #32 | Exceptional 85.8% |
| Immigrants | Bosnia and Herzegovina | 99.9 /100 | #33 | Exceptional 85.8% |
| Ugandans | 99.9 /100 | #34 | Exceptional 85.8% |
| Serbians | 99.9 /100 | #35 | Exceptional 85.8% |
| Albanians | 99.9 /100 | #36 | Exceptional 85.7% |
| Norwegians | 99.9 /100 | #37 | Exceptional 85.7% |