South American vs Syrian In Labor Force | Age 16-19
COMPARE
South American
Syrian
In Labor Force | Age 16-19
In Labor Force | Age 16-19 Comparison
South Americans
Syrians
33.6%
IN LABOR FORCE | AGE 16-19
0.2/ 100
METRIC RATING
286th/ 347
METRIC RANK
37.6%
IN LABOR FORCE | AGE 16-19
90.7/ 100
METRIC RATING
141st/ 347
METRIC RANK
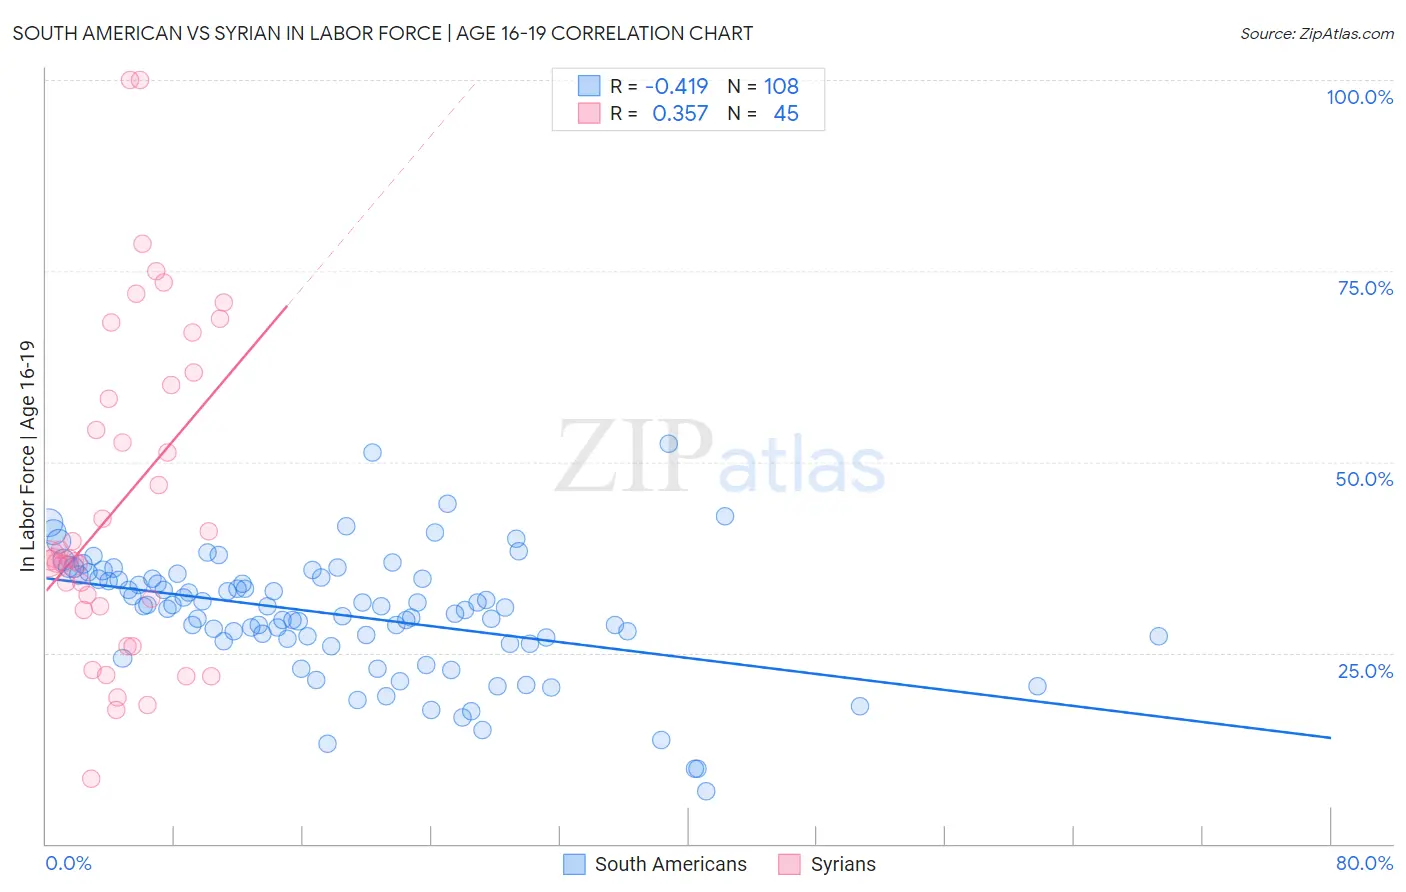
South American vs Syrian In Labor Force | Age 16-19 Correlation Chart
The statistical analysis conducted on geographies consisting of 492,865,168 people shows a moderate negative correlation between the proportion of South Americans and labor force participation rate among population between the ages 16 and 19 in the United States with a correlation coefficient (R) of -0.419 and weighted average of 33.6%. Similarly, the statistical analysis conducted on geographies consisting of 266,042,941 people shows a mild positive correlation between the proportion of Syrians and labor force participation rate among population between the ages 16 and 19 in the United States with a correlation coefficient (R) of 0.357 and weighted average of 37.6%, a difference of 12.0%.
In Labor Force | Age 16-19 Correlation Summary
| Measurement | South American | Syrian |
| Minimum | 6.8% | 8.6% |
| Maximum | 52.4% | 100.0% |
| Range | 45.6% | 91.4% |
| Mean | 30.0% | 44.8% |
| Median | 31.0% | 37.3% |
| Interquartile 25% (IQ1) | 26.6% | 30.9% |
| Interquartile 75% (IQ3) | 34.8% | 60.9% |
| Interquartile Range (IQR) | 8.2% | 30.0% |
| Standard Deviation (Sample) | 8.0% | 21.6% |
| Standard Deviation (Population) | 8.0% | 21.4% |
Similar Demographics by In Labor Force | Age 16-19
Demographics Similar to South Americans by In Labor Force | Age 16-19
In terms of in labor force | age 16-19, the demographic groups most similar to South Americans are U.S. Virgin Islander (33.6%, a difference of 0.080%), Nepalese (33.5%, a difference of 0.23%), Immigrants from Spain (33.7%, a difference of 0.27%), Immigrants from Indonesia (33.5%, a difference of 0.27%), and Immigrants from Singapore (33.5%, a difference of 0.27%).
| Demographics | Rating | Rank | In Labor Force | Age 16-19 |
| Paraguayans | 0.3 /100 | #279 | Tragic 33.8% |
| Taiwanese | 0.3 /100 | #280 | Tragic 33.8% |
| Cypriots | 0.3 /100 | #281 | Tragic 33.8% |
| Immigrants | Korea | 0.3 /100 | #282 | Tragic 33.8% |
| Immigrants | Venezuela | 0.2 /100 | #283 | Tragic 33.7% |
| Immigrants | Spain | 0.2 /100 | #284 | Tragic 33.7% |
| U.S. Virgin Islanders | 0.2 /100 | #285 | Tragic 33.6% |
| South Americans | 0.2 /100 | #286 | Tragic 33.6% |
| Nepalese | 0.1 /100 | #287 | Tragic 33.5% |
| Immigrants | Indonesia | 0.1 /100 | #288 | Tragic 33.5% |
| Immigrants | Singapore | 0.1 /100 | #289 | Tragic 33.5% |
| Immigrants | Colombia | 0.1 /100 | #290 | Tragic 33.5% |
| Immigrants | Belarus | 0.1 /100 | #291 | Tragic 33.4% |
| Haitians | 0.1 /100 | #292 | Tragic 33.4% |
| Immigrants | South America | 0.1 /100 | #293 | Tragic 33.3% |
Demographics Similar to Syrians by In Labor Force | Age 16-19
In terms of in labor force | age 16-19, the demographic groups most similar to Syrians are Estonian (37.7%, a difference of 0.14%), Sierra Leonean (37.6%, a difference of 0.15%), Immigrants from Moldova (37.7%, a difference of 0.17%), Pakistani (37.6%, a difference of 0.18%), and Comanche (37.7%, a difference of 0.19%).
| Demographics | Rating | Rank | In Labor Force | Age 16-19 |
| Immigrants | Netherlands | 93.7 /100 | #134 | Exceptional 37.8% |
| Macedonians | 93.4 /100 | #135 | Exceptional 37.8% |
| Australians | 93.2 /100 | #136 | Exceptional 37.8% |
| Cajuns | 93.2 /100 | #137 | Exceptional 37.8% |
| Comanche | 91.9 /100 | #138 | Exceptional 37.7% |
| Immigrants | Moldova | 91.9 /100 | #139 | Exceptional 37.7% |
| Estonians | 91.7 /100 | #140 | Exceptional 37.7% |
| Syrians | 90.7 /100 | #141 | Exceptional 37.6% |
| Sierra Leoneans | 89.7 /100 | #142 | Excellent 37.6% |
| Pakistanis | 89.5 /100 | #143 | Excellent 37.6% |
| Japanese | 89.3 /100 | #144 | Excellent 37.5% |
| Paiute | 89.3 /100 | #145 | Excellent 37.5% |
| Immigrants | Western Europe | 88.9 /100 | #146 | Excellent 37.5% |
| Brazilians | 88.7 /100 | #147 | Excellent 37.5% |
| Romanians | 87.3 /100 | #148 | Excellent 37.5% |