South American vs Alaskan Athabascan In Labor Force | Age 16-19
COMPARE
South American
Alaskan Athabascan
In Labor Force | Age 16-19
In Labor Force | Age 16-19 Comparison
South Americans
Alaskan Athabascans
33.6%
IN LABOR FORCE | AGE 16-19
0.2/ 100
METRIC RATING
286th/ 347
METRIC RANK
45.2%
IN LABOR FORCE | AGE 16-19
100.0/ 100
METRIC RATING
5th/ 347
METRIC RANK
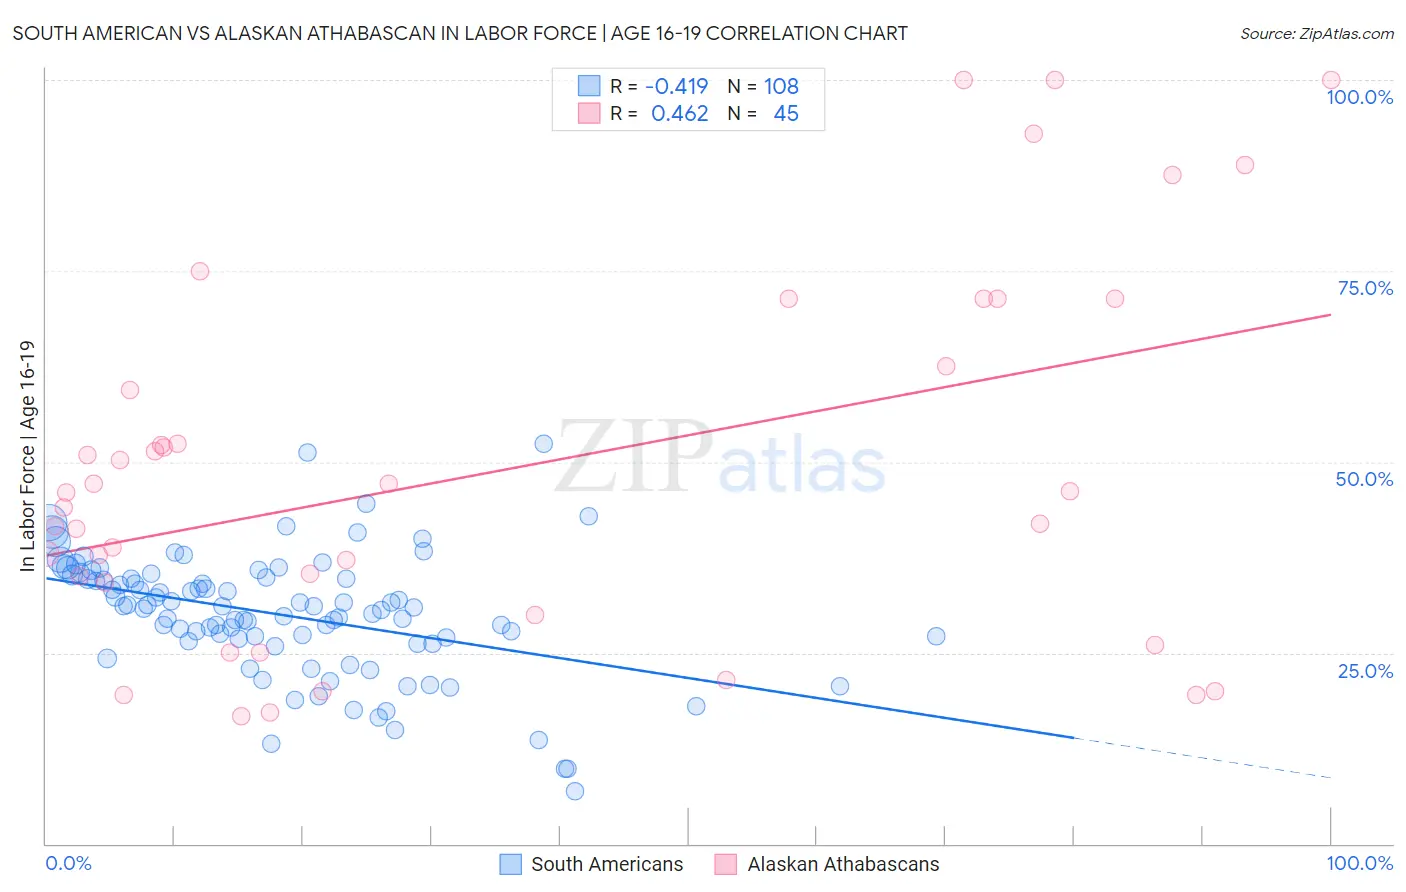
South American vs Alaskan Athabascan In Labor Force | Age 16-19 Correlation Chart
The statistical analysis conducted on geographies consisting of 492,865,168 people shows a moderate negative correlation between the proportion of South Americans and labor force participation rate among population between the ages 16 and 19 in the United States with a correlation coefficient (R) of -0.419 and weighted average of 33.6%. Similarly, the statistical analysis conducted on geographies consisting of 45,777,362 people shows a moderate positive correlation between the proportion of Alaskan Athabascans and labor force participation rate among population between the ages 16 and 19 in the United States with a correlation coefficient (R) of 0.462 and weighted average of 45.2%, a difference of 34.6%.
In Labor Force | Age 16-19 Correlation Summary
| Measurement | South American | Alaskan Athabascan |
| Minimum | 6.8% | 16.7% |
| Maximum | 52.4% | 100.0% |
| Range | 45.6% | 83.3% |
| Mean | 30.0% | 49.2% |
| Median | 31.0% | 46.0% |
| Interquartile 25% (IQ1) | 26.6% | 32.1% |
| Interquartile 75% (IQ3) | 34.8% | 66.9% |
| Interquartile Range (IQR) | 8.2% | 34.8% |
| Standard Deviation (Sample) | 8.0% | 24.0% |
| Standard Deviation (Population) | 8.0% | 23.8% |
Similar Demographics by In Labor Force | Age 16-19
Demographics Similar to South Americans by In Labor Force | Age 16-19
In terms of in labor force | age 16-19, the demographic groups most similar to South Americans are U.S. Virgin Islander (33.6%, a difference of 0.080%), Nepalese (33.5%, a difference of 0.23%), Immigrants from Spain (33.7%, a difference of 0.27%), Immigrants from Indonesia (33.5%, a difference of 0.27%), and Immigrants from Singapore (33.5%, a difference of 0.27%).
| Demographics | Rating | Rank | In Labor Force | Age 16-19 |
| Paraguayans | 0.3 /100 | #279 | Tragic 33.8% |
| Taiwanese | 0.3 /100 | #280 | Tragic 33.8% |
| Cypriots | 0.3 /100 | #281 | Tragic 33.8% |
| Immigrants | Korea | 0.3 /100 | #282 | Tragic 33.8% |
| Immigrants | Venezuela | 0.2 /100 | #283 | Tragic 33.7% |
| Immigrants | Spain | 0.2 /100 | #284 | Tragic 33.7% |
| U.S. Virgin Islanders | 0.2 /100 | #285 | Tragic 33.6% |
| South Americans | 0.2 /100 | #286 | Tragic 33.6% |
| Nepalese | 0.1 /100 | #287 | Tragic 33.5% |
| Immigrants | Indonesia | 0.1 /100 | #288 | Tragic 33.5% |
| Immigrants | Singapore | 0.1 /100 | #289 | Tragic 33.5% |
| Immigrants | Colombia | 0.1 /100 | #290 | Tragic 33.5% |
| Immigrants | Belarus | 0.1 /100 | #291 | Tragic 33.4% |
| Haitians | 0.1 /100 | #292 | Tragic 33.4% |
| Immigrants | South America | 0.1 /100 | #293 | Tragic 33.3% |
Demographics Similar to Alaskan Athabascans by In Labor Force | Age 16-19
In terms of in labor force | age 16-19, the demographic groups most similar to Alaskan Athabascans are Somali (45.1%, a difference of 0.17%), Luxembourger (45.3%, a difference of 0.18%), Immigrants from Somalia (45.6%, a difference of 0.83%), Danish (44.7%, a difference of 1.1%), and Immigrants from Cabo Verde (44.7%, a difference of 1.2%).
| Demographics | Rating | Rank | In Labor Force | Age 16-19 |
| Pennsylvania Germans | 100.0 /100 | #1 | Exceptional 46.4% |
| Norwegians | 100.0 /100 | #2 | Exceptional 46.2% |
| Immigrants | Somalia | 100.0 /100 | #3 | Exceptional 45.6% |
| Luxembourgers | 100.0 /100 | #4 | Exceptional 45.3% |
| Alaskan Athabascans | 100.0 /100 | #5 | Exceptional 45.2% |
| Somalis | 100.0 /100 | #6 | Exceptional 45.1% |
| Danes | 100.0 /100 | #7 | Exceptional 44.7% |
| Immigrants | Cabo Verde | 100.0 /100 | #8 | Exceptional 44.7% |
| Cape Verdeans | 100.0 /100 | #9 | Exceptional 44.5% |
| Germans | 100.0 /100 | #10 | Exceptional 44.2% |
| Swedes | 100.0 /100 | #11 | Exceptional 44.1% |
| Finns | 100.0 /100 | #12 | Exceptional 43.9% |
| Dutch | 100.0 /100 | #13 | Exceptional 43.8% |
| Chippewa | 100.0 /100 | #14 | Exceptional 43.8% |
| Slovenes | 100.0 /100 | #15 | Exceptional 43.7% |