South American Indian vs Bahamian In Labor Force | Age 25-29
COMPARE
South American Indian
Bahamian
In Labor Force | Age 25-29
In Labor Force | Age 25-29 Comparison
South American Indians
Bahamians
84.5%
IN LABOR FORCE | AGE 25-29
25.0/ 100
METRIC RATING
193rd/ 347
METRIC RANK
83.7%
IN LABOR FORCE | AGE 25-29
0.2/ 100
METRIC RATING
251st/ 347
METRIC RANK
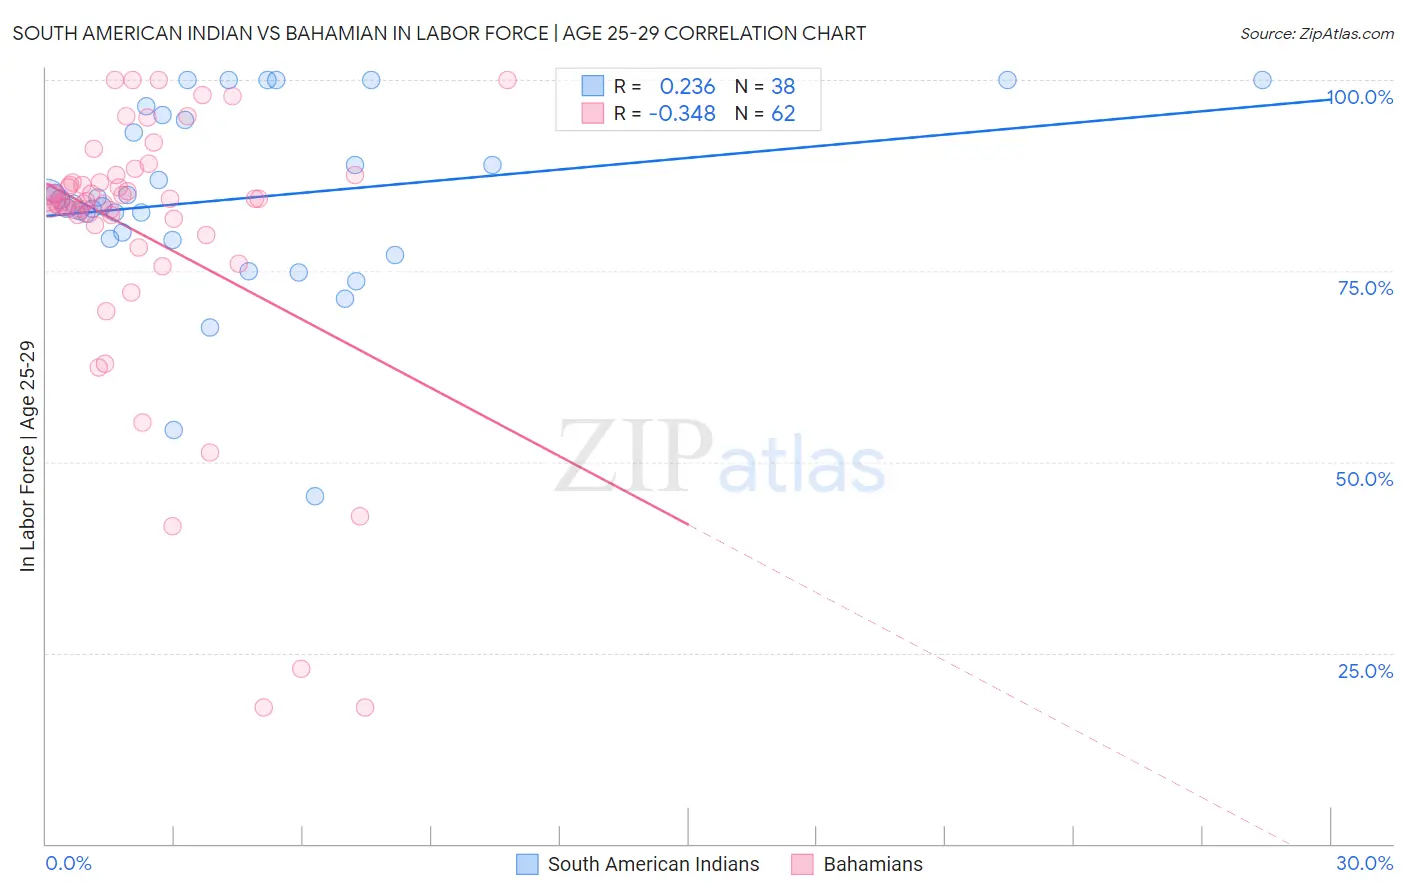
South American Indian vs Bahamian In Labor Force | Age 25-29 Correlation Chart
The statistical analysis conducted on geographies consisting of 164,547,486 people shows a weak positive correlation between the proportion of South American Indians and labor force participation rate among population between the ages 25 and 29 in the United States with a correlation coefficient (R) of 0.236 and weighted average of 84.5%. Similarly, the statistical analysis conducted on geographies consisting of 112,690,388 people shows a mild negative correlation between the proportion of Bahamians and labor force participation rate among population between the ages 25 and 29 in the United States with a correlation coefficient (R) of -0.348 and weighted average of 83.7%, a difference of 0.94%.
In Labor Force | Age 25-29 Correlation Summary
| Measurement | South American Indian | Bahamian |
| Minimum | 45.5% | 17.9% |
| Maximum | 100.0% | 100.0% |
| Range | 54.5% | 82.1% |
| Mean | 84.5% | 79.6% |
| Median | 84.1% | 84.1% |
| Interquartile 25% (IQ1) | 79.3% | 81.1% |
| Interquartile 75% (IQ3) | 94.7% | 86.5% |
| Interquartile Range (IQR) | 15.4% | 5.5% |
| Standard Deviation (Sample) | 12.2% | 18.2% |
| Standard Deviation (Population) | 12.0% | 18.0% |
Similar Demographics by In Labor Force | Age 25-29
Demographics Similar to South American Indians by In Labor Force | Age 25-29
In terms of in labor force | age 25-29, the demographic groups most similar to South American Indians are English (84.5%, a difference of 0.010%), Zimbabwean (84.5%, a difference of 0.030%), Portuguese (84.4%, a difference of 0.040%), Immigrants from Israel (84.4%, a difference of 0.040%), and Welsh (84.5%, a difference of 0.060%).
| Demographics | Rating | Rank | In Labor Force | Age 25-29 |
| Immigrants | Belgium | 35.0 /100 | #186 | Fair 84.6% |
| Immigrants | Portugal | 34.7 /100 | #187 | Fair 84.6% |
| Immigrants | Ukraine | 33.7 /100 | #188 | Fair 84.5% |
| Moroccans | 32.6 /100 | #189 | Fair 84.5% |
| Welsh | 31.1 /100 | #190 | Fair 84.5% |
| Zimbabweans | 28.7 /100 | #191 | Fair 84.5% |
| English | 25.8 /100 | #192 | Fair 84.5% |
| South American Indians | 25.0 /100 | #193 | Fair 84.5% |
| Portuguese | 21.2 /100 | #194 | Fair 84.4% |
| Immigrants | Israel | 20.8 /100 | #195 | Fair 84.4% |
| Immigrants | South Eastern Asia | 19.5 /100 | #196 | Poor 84.4% |
| Tlingit-Haida | 19.3 /100 | #197 | Poor 84.4% |
| Immigrants | Iraq | 19.0 /100 | #198 | Poor 84.4% |
| Immigrants | Germany | 18.3 /100 | #199 | Poor 84.4% |
| Immigrants | Kazakhstan | 17.5 /100 | #200 | Poor 84.4% |
Demographics Similar to Bahamians by In Labor Force | Age 25-29
In terms of in labor force | age 25-29, the demographic groups most similar to Bahamians are Guatemalan (83.7%, a difference of 0.010%), Immigrants from Trinidad and Tobago (83.7%, a difference of 0.010%), Spaniard (83.7%, a difference of 0.010%), Central American (83.7%, a difference of 0.020%), and Hmong (83.7%, a difference of 0.030%).
| Demographics | Rating | Rank | In Labor Force | Age 25-29 |
| Immigrants | Jamaica | 0.4 /100 | #244 | Tragic 83.8% |
| Iroquois | 0.4 /100 | #245 | Tragic 83.8% |
| Cree | 0.3 /100 | #246 | Tragic 83.8% |
| Immigrants | El Salvador | 0.3 /100 | #247 | Tragic 83.7% |
| Immigrants | Nonimmigrants | 0.3 /100 | #248 | Tragic 83.7% |
| Hmong | 0.3 /100 | #249 | Tragic 83.7% |
| Central Americans | 0.2 /100 | #250 | Tragic 83.7% |
| Bahamians | 0.2 /100 | #251 | Tragic 83.7% |
| Guatemalans | 0.2 /100 | #252 | Tragic 83.7% |
| Immigrants | Trinidad and Tobago | 0.2 /100 | #253 | Tragic 83.7% |
| Spaniards | 0.2 /100 | #254 | Tragic 83.7% |
| Haitians | 0.2 /100 | #255 | Tragic 83.7% |
| Immigrants | Haiti | 0.2 /100 | #256 | Tragic 83.7% |
| Delaware | 0.2 /100 | #257 | Tragic 83.7% |
| Immigrants | Guatemala | 0.1 /100 | #258 | Tragic 83.6% |