South American Indian vs Shoshone In Labor Force | Age 25-29
COMPARE
South American Indian
Shoshone
In Labor Force | Age 25-29
In Labor Force | Age 25-29 Comparison
South American Indians
Shoshone
84.5%
IN LABOR FORCE | AGE 25-29
25.0/ 100
METRIC RATING
193rd/ 347
METRIC RANK
81.6%
IN LABOR FORCE | AGE 25-29
0.0/ 100
METRIC RATING
321st/ 347
METRIC RANK
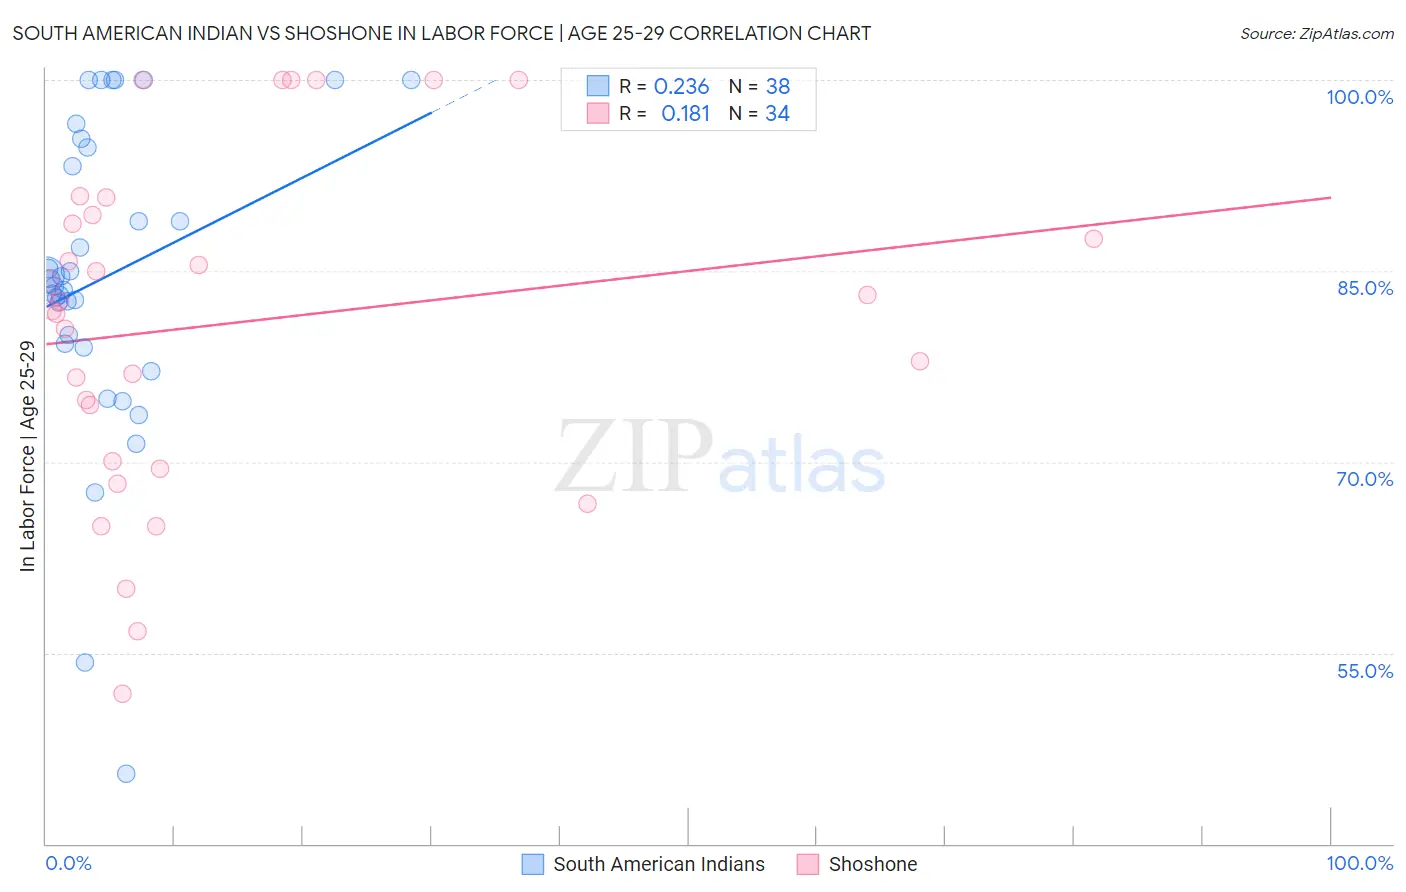
South American Indian vs Shoshone In Labor Force | Age 25-29 Correlation Chart
The statistical analysis conducted on geographies consisting of 164,547,486 people shows a weak positive correlation between the proportion of South American Indians and labor force participation rate among population between the ages 25 and 29 in the United States with a correlation coefficient (R) of 0.236 and weighted average of 84.5%. Similarly, the statistical analysis conducted on geographies consisting of 66,617,603 people shows a poor positive correlation between the proportion of Shoshone and labor force participation rate among population between the ages 25 and 29 in the United States with a correlation coefficient (R) of 0.181 and weighted average of 81.6%, a difference of 3.5%.
In Labor Force | Age 25-29 Correlation Summary
| Measurement | South American Indian | Shoshone |
| Minimum | 45.5% | 51.8% |
| Maximum | 100.0% | 100.0% |
| Range | 54.5% | 48.2% |
| Mean | 84.5% | 80.9% |
| Median | 84.1% | 82.2% |
| Interquartile 25% (IQ1) | 79.3% | 70.1% |
| Interquartile 75% (IQ3) | 94.7% | 89.4% |
| Interquartile Range (IQR) | 15.4% | 19.3% |
| Standard Deviation (Sample) | 12.2% | 13.2% |
| Standard Deviation (Population) | 12.0% | 13.0% |
Similar Demographics by In Labor Force | Age 25-29
Demographics Similar to South American Indians by In Labor Force | Age 25-29
In terms of in labor force | age 25-29, the demographic groups most similar to South American Indians are English (84.5%, a difference of 0.010%), Zimbabwean (84.5%, a difference of 0.030%), Portuguese (84.4%, a difference of 0.040%), Immigrants from Israel (84.4%, a difference of 0.040%), and Welsh (84.5%, a difference of 0.060%).
| Demographics | Rating | Rank | In Labor Force | Age 25-29 |
| Immigrants | Belgium | 35.0 /100 | #186 | Fair 84.6% |
| Immigrants | Portugal | 34.7 /100 | #187 | Fair 84.6% |
| Immigrants | Ukraine | 33.7 /100 | #188 | Fair 84.5% |
| Moroccans | 32.6 /100 | #189 | Fair 84.5% |
| Welsh | 31.1 /100 | #190 | Fair 84.5% |
| Zimbabweans | 28.7 /100 | #191 | Fair 84.5% |
| English | 25.8 /100 | #192 | Fair 84.5% |
| South American Indians | 25.0 /100 | #193 | Fair 84.5% |
| Portuguese | 21.2 /100 | #194 | Fair 84.4% |
| Immigrants | Israel | 20.8 /100 | #195 | Fair 84.4% |
| Immigrants | South Eastern Asia | 19.5 /100 | #196 | Poor 84.4% |
| Tlingit-Haida | 19.3 /100 | #197 | Poor 84.4% |
| Immigrants | Iraq | 19.0 /100 | #198 | Poor 84.4% |
| Immigrants | Germany | 18.3 /100 | #199 | Poor 84.4% |
| Immigrants | Kazakhstan | 17.5 /100 | #200 | Poor 84.4% |
Demographics Similar to Shoshone by In Labor Force | Age 25-29
In terms of in labor force | age 25-29, the demographic groups most similar to Shoshone are Kiowa (81.6%, a difference of 0.010%), Colville (81.6%, a difference of 0.060%), Alaska Native (81.6%, a difference of 0.060%), Seminole (81.7%, a difference of 0.11%), and Comanche (81.9%, a difference of 0.32%).
| Demographics | Rating | Rank | In Labor Force | Age 25-29 |
| Cherokee | 0.0 /100 | #314 | Tragic 82.1% |
| Immigrants | Mexico | 0.0 /100 | #315 | Tragic 82.0% |
| Mexicans | 0.0 /100 | #316 | Tragic 81.9% |
| Chickasaw | 0.0 /100 | #317 | Tragic 81.9% |
| Comanche | 0.0 /100 | #318 | Tragic 81.9% |
| Seminole | 0.0 /100 | #319 | Tragic 81.7% |
| Colville | 0.0 /100 | #320 | Tragic 81.6% |
| Shoshone | 0.0 /100 | #321 | Tragic 81.6% |
| Kiowa | 0.0 /100 | #322 | Tragic 81.6% |
| Alaska Natives | 0.0 /100 | #323 | Tragic 81.6% |
| Houma | 0.0 /100 | #324 | Tragic 81.2% |
| Dutch West Indians | 0.0 /100 | #325 | Tragic 81.1% |
| Choctaw | 0.0 /100 | #326 | Tragic 81.0% |
| Ute | 0.0 /100 | #327 | Tragic 80.8% |
| Creek | 0.0 /100 | #328 | Tragic 80.7% |