South American Indian vs Immigrants from the Azores In Labor Force | Age 25-29
COMPARE
South American Indian
Immigrants from the Azores
In Labor Force | Age 25-29
In Labor Force | Age 25-29 Comparison
South American Indians
Immigrants from the Azores
84.5%
IN LABOR FORCE | AGE 25-29
25.0/ 100
METRIC RATING
193rd/ 347
METRIC RANK
83.1%
IN LABOR FORCE | AGE 25-29
0.0/ 100
METRIC RATING
283rd/ 347
METRIC RANK
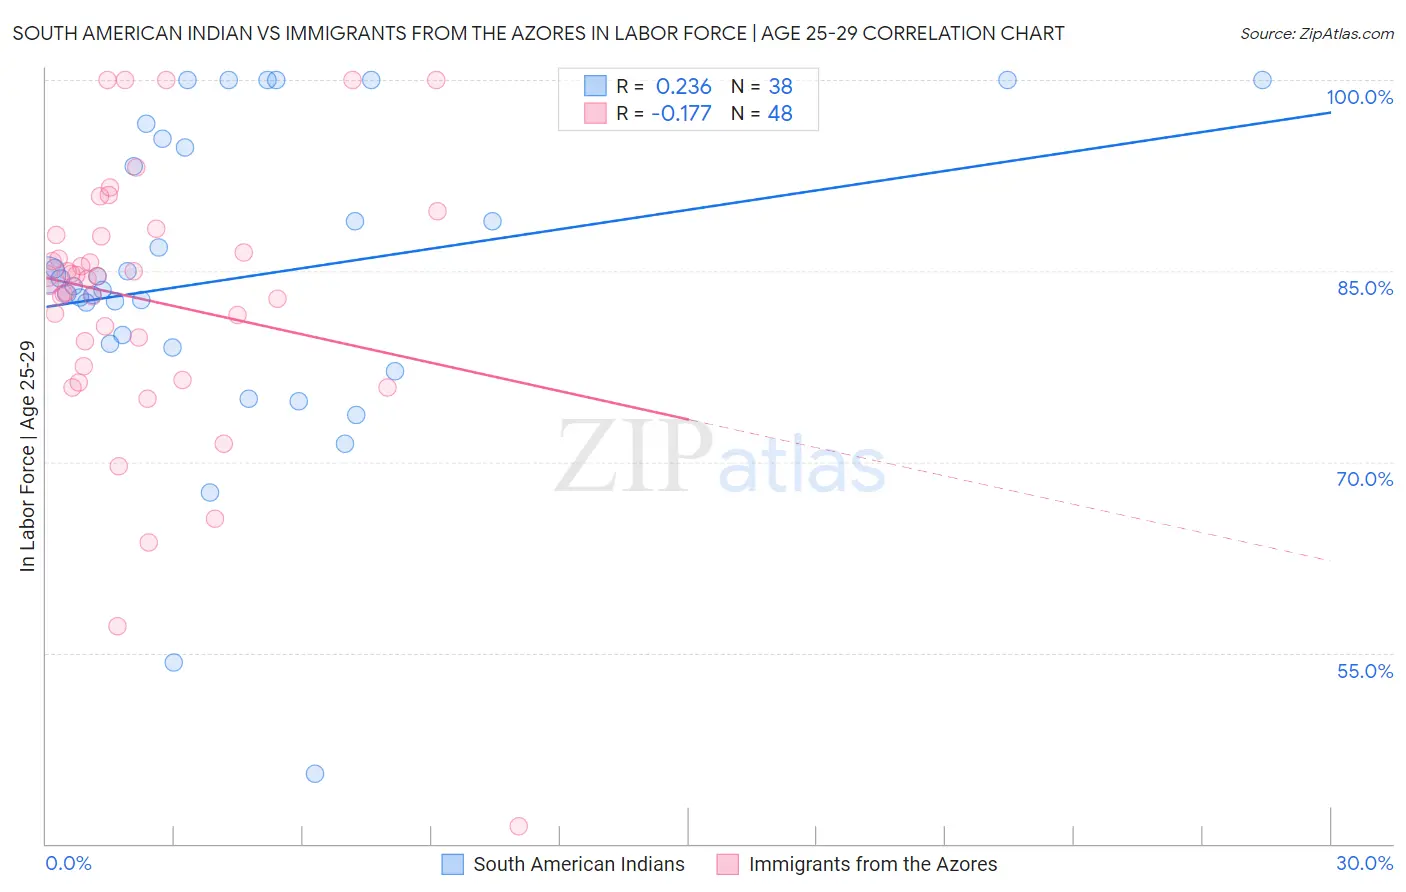
South American Indian vs Immigrants from the Azores In Labor Force | Age 25-29 Correlation Chart
The statistical analysis conducted on geographies consisting of 164,547,486 people shows a weak positive correlation between the proportion of South American Indians and labor force participation rate among population between the ages 25 and 29 in the United States with a correlation coefficient (R) of 0.236 and weighted average of 84.5%. Similarly, the statistical analysis conducted on geographies consisting of 46,246,668 people shows a poor negative correlation between the proportion of Immigrants from the Azores and labor force participation rate among population between the ages 25 and 29 in the United States with a correlation coefficient (R) of -0.177 and weighted average of 83.1%, a difference of 1.7%.
In Labor Force | Age 25-29 Correlation Summary
| Measurement | South American Indian | Immigrants from the Azores |
| Minimum | 45.5% | 41.4% |
| Maximum | 100.0% | 100.0% |
| Range | 54.5% | 58.6% |
| Mean | 84.5% | 82.7% |
| Median | 84.1% | 84.5% |
| Interquartile 25% (IQ1) | 79.3% | 78.5% |
| Interquartile 75% (IQ3) | 94.7% | 87.8% |
| Interquartile Range (IQR) | 15.4% | 9.3% |
| Standard Deviation (Sample) | 12.2% | 10.9% |
| Standard Deviation (Population) | 12.0% | 10.8% |
Similar Demographics by In Labor Force | Age 25-29
Demographics Similar to South American Indians by In Labor Force | Age 25-29
In terms of in labor force | age 25-29, the demographic groups most similar to South American Indians are English (84.5%, a difference of 0.010%), Zimbabwean (84.5%, a difference of 0.030%), Portuguese (84.4%, a difference of 0.040%), Immigrants from Israel (84.4%, a difference of 0.040%), and Welsh (84.5%, a difference of 0.060%).
| Demographics | Rating | Rank | In Labor Force | Age 25-29 |
| Immigrants | Belgium | 35.0 /100 | #186 | Fair 84.6% |
| Immigrants | Portugal | 34.7 /100 | #187 | Fair 84.6% |
| Immigrants | Ukraine | 33.7 /100 | #188 | Fair 84.5% |
| Moroccans | 32.6 /100 | #189 | Fair 84.5% |
| Welsh | 31.1 /100 | #190 | Fair 84.5% |
| Zimbabweans | 28.7 /100 | #191 | Fair 84.5% |
| English | 25.8 /100 | #192 | Fair 84.5% |
| South American Indians | 25.0 /100 | #193 | Fair 84.5% |
| Portuguese | 21.2 /100 | #194 | Fair 84.4% |
| Immigrants | Israel | 20.8 /100 | #195 | Fair 84.4% |
| Immigrants | South Eastern Asia | 19.5 /100 | #196 | Poor 84.4% |
| Tlingit-Haida | 19.3 /100 | #197 | Poor 84.4% |
| Immigrants | Iraq | 19.0 /100 | #198 | Poor 84.4% |
| Immigrants | Germany | 18.3 /100 | #199 | Poor 84.4% |
| Immigrants | Kazakhstan | 17.5 /100 | #200 | Poor 84.4% |
Demographics Similar to Immigrants from the Azores by In Labor Force | Age 25-29
In terms of in labor force | age 25-29, the demographic groups most similar to Immigrants from the Azores are American (83.1%, a difference of 0.0%), Immigrants from Dominican Republic (83.1%, a difference of 0.010%), Nicaraguan (83.1%, a difference of 0.020%), Belizean (83.1%, a difference of 0.060%), and Dominican (83.2%, a difference of 0.070%).
| Demographics | Rating | Rank | In Labor Force | Age 25-29 |
| Immigrants | Honduras | 0.0 /100 | #276 | Tragic 83.3% |
| Africans | 0.0 /100 | #277 | Tragic 83.2% |
| Immigrants | Cuba | 0.0 /100 | #278 | Tragic 83.2% |
| British West Indians | 0.0 /100 | #279 | Tragic 83.2% |
| Dominicans | 0.0 /100 | #280 | Tragic 83.2% |
| Immigrants | Dominican Republic | 0.0 /100 | #281 | Tragic 83.1% |
| Americans | 0.0 /100 | #282 | Tragic 83.1% |
| Immigrants | Azores | 0.0 /100 | #283 | Tragic 83.1% |
| Nicaraguans | 0.0 /100 | #284 | Tragic 83.1% |
| Belizeans | 0.0 /100 | #285 | Tragic 83.1% |
| Mexican American Indians | 0.0 /100 | #286 | Tragic 83.0% |
| Guyanese | 0.0 /100 | #287 | Tragic 83.0% |
| Ottawa | 0.0 /100 | #288 | Tragic 83.0% |
| Immigrants | Micronesia | 0.0 /100 | #289 | Tragic 83.0% |
| Immigrants | Bangladesh | 0.0 /100 | #290 | Tragic 83.0% |