Immigrants from Serbia vs Bahamian In Labor Force | Age 25-29
COMPARE
Immigrants from Serbia
Bahamian
In Labor Force | Age 25-29
In Labor Force | Age 25-29 Comparison
Immigrants from Serbia
Bahamians
85.9%
IN LABOR FORCE | AGE 25-29
100.0/ 100
METRIC RATING
30th/ 347
METRIC RANK
83.7%
IN LABOR FORCE | AGE 25-29
0.2/ 100
METRIC RATING
251st/ 347
METRIC RANK
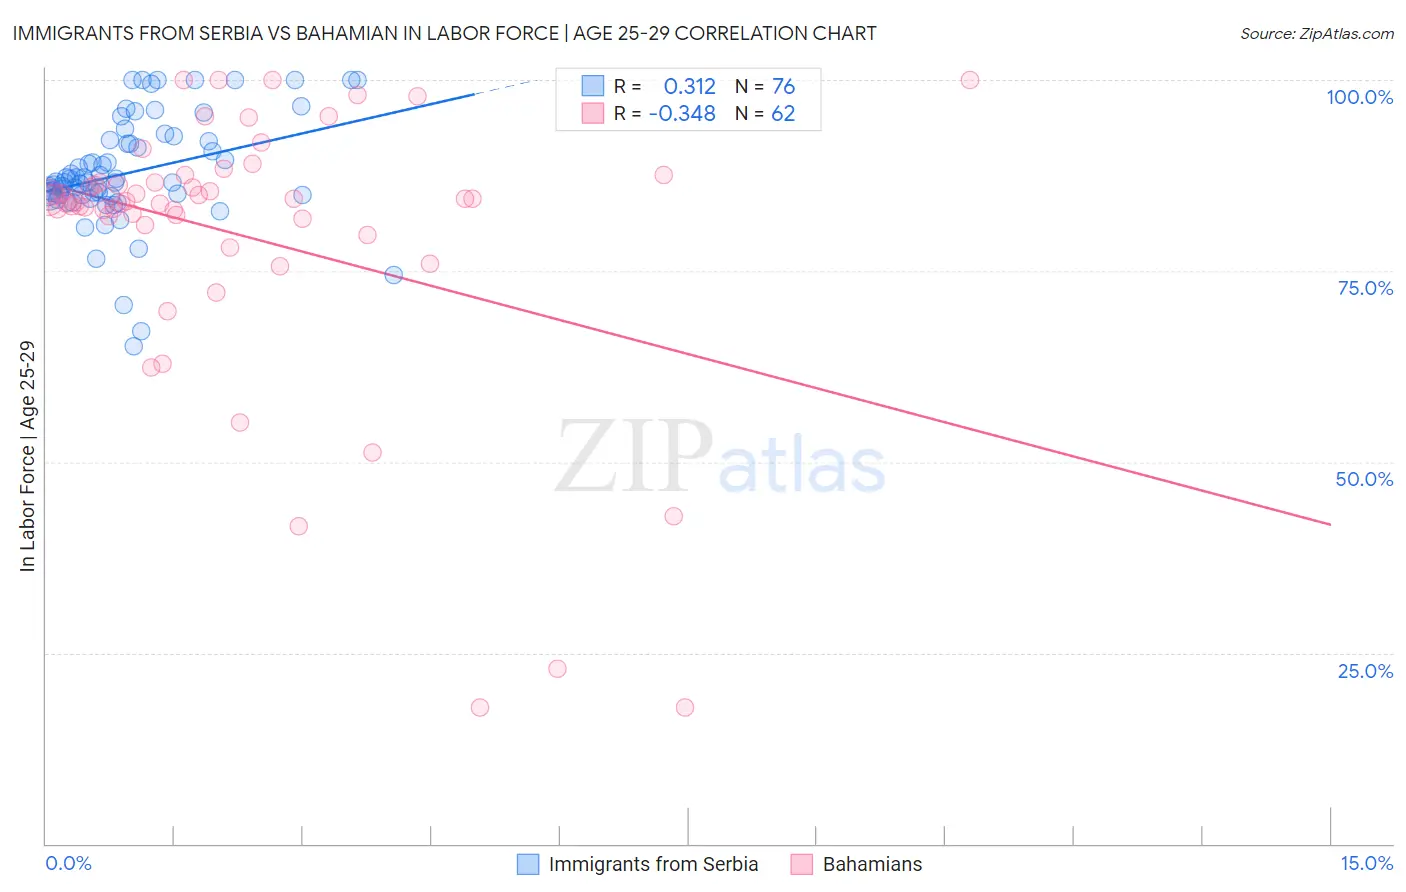
Immigrants from Serbia vs Bahamian In Labor Force | Age 25-29 Correlation Chart
The statistical analysis conducted on geographies consisting of 131,726,822 people shows a mild positive correlation between the proportion of Immigrants from Serbia and labor force participation rate among population between the ages 25 and 29 in the United States with a correlation coefficient (R) of 0.312 and weighted average of 85.9%. Similarly, the statistical analysis conducted on geographies consisting of 112,690,388 people shows a mild negative correlation between the proportion of Bahamians and labor force participation rate among population between the ages 25 and 29 in the United States with a correlation coefficient (R) of -0.348 and weighted average of 83.7%, a difference of 2.6%.
In Labor Force | Age 25-29 Correlation Summary
| Measurement | Immigrants from Serbia | Bahamian |
| Minimum | 65.1% | 17.9% |
| Maximum | 100.0% | 100.0% |
| Range | 34.9% | 82.1% |
| Mean | 87.9% | 79.6% |
| Median | 86.6% | 84.1% |
| Interquartile 25% (IQ1) | 84.9% | 81.1% |
| Interquartile 75% (IQ3) | 92.0% | 86.5% |
| Interquartile Range (IQR) | 7.1% | 5.5% |
| Standard Deviation (Sample) | 7.2% | 18.2% |
| Standard Deviation (Population) | 7.2% | 18.0% |
Similar Demographics by In Labor Force | Age 25-29
Demographics Similar to Immigrants from Serbia by In Labor Force | Age 25-29
In terms of in labor force | age 25-29, the demographic groups most similar to Immigrants from Serbia are German Russian (85.8%, a difference of 0.010%), Slovak (85.8%, a difference of 0.010%), Immigrants from Bulgaria (85.8%, a difference of 0.020%), Ugandan (85.9%, a difference of 0.040%), and Immigrants from Liberia (85.9%, a difference of 0.040%).
| Demographics | Rating | Rank | In Labor Force | Age 25-29 |
| Immigrants | Uganda | 100.0 /100 | #23 | Exceptional 86.0% |
| Immigrants | Eastern Africa | 100.0 /100 | #24 | Exceptional 86.0% |
| Sudanese | 100.0 /100 | #25 | Exceptional 85.9% |
| Immigrants | North Macedonia | 100.0 /100 | #26 | Exceptional 85.9% |
| Paraguayans | 100.0 /100 | #27 | Exceptional 85.9% |
| Ugandans | 100.0 /100 | #28 | Exceptional 85.9% |
| Immigrants | Liberia | 100.0 /100 | #29 | Exceptional 85.9% |
| Immigrants | Serbia | 100.0 /100 | #30 | Exceptional 85.9% |
| German Russians | 100.0 /100 | #31 | Exceptional 85.8% |
| Slovaks | 100.0 /100 | #32 | Exceptional 85.8% |
| Immigrants | Bulgaria | 100.0 /100 | #33 | Exceptional 85.8% |
| Lithuanians | 99.9 /100 | #34 | Exceptional 85.8% |
| Cypriots | 99.9 /100 | #35 | Exceptional 85.8% |
| Immigrants | Nepal | 99.9 /100 | #36 | Exceptional 85.8% |
| Poles | 99.9 /100 | #37 | Exceptional 85.8% |
Demographics Similar to Bahamians by In Labor Force | Age 25-29
In terms of in labor force | age 25-29, the demographic groups most similar to Bahamians are Guatemalan (83.7%, a difference of 0.010%), Immigrants from Trinidad and Tobago (83.7%, a difference of 0.010%), Spaniard (83.7%, a difference of 0.010%), Central American (83.7%, a difference of 0.020%), and Hmong (83.7%, a difference of 0.030%).
| Demographics | Rating | Rank | In Labor Force | Age 25-29 |
| Immigrants | Jamaica | 0.4 /100 | #244 | Tragic 83.8% |
| Iroquois | 0.4 /100 | #245 | Tragic 83.8% |
| Cree | 0.3 /100 | #246 | Tragic 83.8% |
| Immigrants | El Salvador | 0.3 /100 | #247 | Tragic 83.7% |
| Immigrants | Nonimmigrants | 0.3 /100 | #248 | Tragic 83.7% |
| Hmong | 0.3 /100 | #249 | Tragic 83.7% |
| Central Americans | 0.2 /100 | #250 | Tragic 83.7% |
| Bahamians | 0.2 /100 | #251 | Tragic 83.7% |
| Guatemalans | 0.2 /100 | #252 | Tragic 83.7% |
| Immigrants | Trinidad and Tobago | 0.2 /100 | #253 | Tragic 83.7% |
| Spaniards | 0.2 /100 | #254 | Tragic 83.7% |
| Haitians | 0.2 /100 | #255 | Tragic 83.7% |
| Immigrants | Haiti | 0.2 /100 | #256 | Tragic 83.7% |
| Delaware | 0.2 /100 | #257 | Tragic 83.7% |
| Immigrants | Guatemala | 0.1 /100 | #258 | Tragic 83.6% |