Honduran vs Bahamian In Labor Force | Age 25-29
COMPARE
Honduran
Bahamian
In Labor Force | Age 25-29
In Labor Force | Age 25-29 Comparison
Hondurans
Bahamians
83.4%
IN LABOR FORCE | AGE 25-29
0.0/ 100
METRIC RATING
271st/ 347
METRIC RANK
83.7%
IN LABOR FORCE | AGE 25-29
0.2/ 100
METRIC RATING
251st/ 347
METRIC RANK
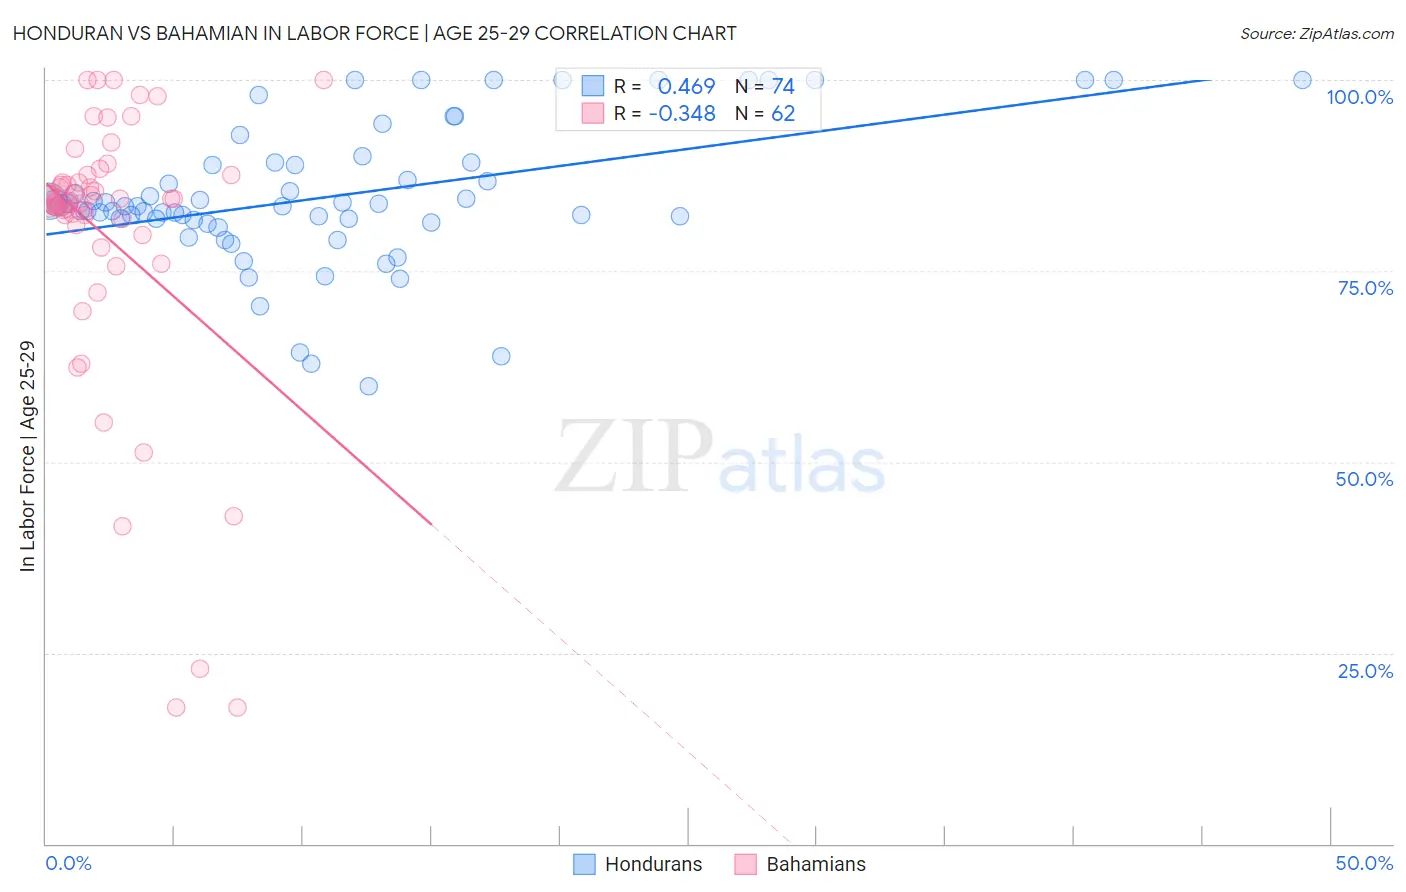
Honduran vs Bahamian In Labor Force | Age 25-29 Correlation Chart
The statistical analysis conducted on geographies consisting of 357,747,922 people shows a moderate positive correlation between the proportion of Hondurans and labor force participation rate among population between the ages 25 and 29 in the United States with a correlation coefficient (R) of 0.469 and weighted average of 83.4%. Similarly, the statistical analysis conducted on geographies consisting of 112,690,388 people shows a mild negative correlation between the proportion of Bahamians and labor force participation rate among population between the ages 25 and 29 in the United States with a correlation coefficient (R) of -0.348 and weighted average of 83.7%, a difference of 0.37%.
In Labor Force | Age 25-29 Correlation Summary
| Measurement | Honduran | Bahamian |
| Minimum | 59.9% | 17.9% |
| Maximum | 100.0% | 100.0% |
| Range | 40.1% | 82.1% |
| Mean | 84.8% | 79.6% |
| Median | 83.5% | 84.1% |
| Interquartile 25% (IQ1) | 81.7% | 81.1% |
| Interquartile 75% (IQ3) | 89.2% | 86.5% |
| Interquartile Range (IQR) | 7.5% | 5.5% |
| Standard Deviation (Sample) | 9.2% | 18.2% |
| Standard Deviation (Population) | 9.2% | 18.0% |
Demographics Similar to Hondurans and Bahamians by In Labor Force | Age 25-29
In terms of in labor force | age 25-29, the demographic groups most similar to Hondurans are Basque (83.4%, a difference of 0.020%), Immigrants from Lebanon (83.4%, a difference of 0.040%), Immigrants from Barbados (83.4%, a difference of 0.040%), Spanish American (83.4%, a difference of 0.050%), and Aleut (83.4%, a difference of 0.060%). Similarly, the demographic groups most similar to Bahamians are Guatemalan (83.7%, a difference of 0.010%), Immigrants from Trinidad and Tobago (83.7%, a difference of 0.010%), Spaniard (83.7%, a difference of 0.010%), Haitian (83.7%, a difference of 0.030%), and Immigrants from Haiti (83.7%, a difference of 0.030%).
| Demographics | Rating | Rank | In Labor Force | Age 25-29 |
| Bahamians | 0.2 /100 | #251 | Tragic 83.7% |
| Guatemalans | 0.2 /100 | #252 | Tragic 83.7% |
| Immigrants | Trinidad and Tobago | 0.2 /100 | #253 | Tragic 83.7% |
| Spaniards | 0.2 /100 | #254 | Tragic 83.7% |
| Haitians | 0.2 /100 | #255 | Tragic 83.7% |
| Immigrants | Haiti | 0.2 /100 | #256 | Tragic 83.7% |
| Delaware | 0.2 /100 | #257 | Tragic 83.7% |
| Immigrants | Guatemala | 0.1 /100 | #258 | Tragic 83.6% |
| Spanish | 0.1 /100 | #259 | Tragic 83.6% |
| Immigrants | Bahamas | 0.1 /100 | #260 | Tragic 83.6% |
| Pennsylvania Germans | 0.1 /100 | #261 | Tragic 83.6% |
| Immigrants | Fiji | 0.1 /100 | #262 | Tragic 83.6% |
| West Indians | 0.1 /100 | #263 | Tragic 83.5% |
| Puget Sound Salish | 0.1 /100 | #264 | Tragic 83.5% |
| Cubans | 0.1 /100 | #265 | Tragic 83.5% |
| Aleuts | 0.0 /100 | #266 | Tragic 83.4% |
| Spanish Americans | 0.0 /100 | #267 | Tragic 83.4% |
| Immigrants | Lebanon | 0.0 /100 | #268 | Tragic 83.4% |
| Immigrants | Barbados | 0.0 /100 | #269 | Tragic 83.4% |
| Basques | 0.0 /100 | #270 | Tragic 83.4% |
| Hondurans | 0.0 /100 | #271 | Tragic 83.4% |