Turkish vs Bahamian In Labor Force | Age 25-29
COMPARE
Turkish
Bahamian
In Labor Force | Age 25-29
In Labor Force | Age 25-29 Comparison
Turks
Bahamians
85.6%
IN LABOR FORCE | AGE 25-29
99.8/ 100
METRIC RATING
47th/ 347
METRIC RANK
83.7%
IN LABOR FORCE | AGE 25-29
0.2/ 100
METRIC RATING
251st/ 347
METRIC RANK
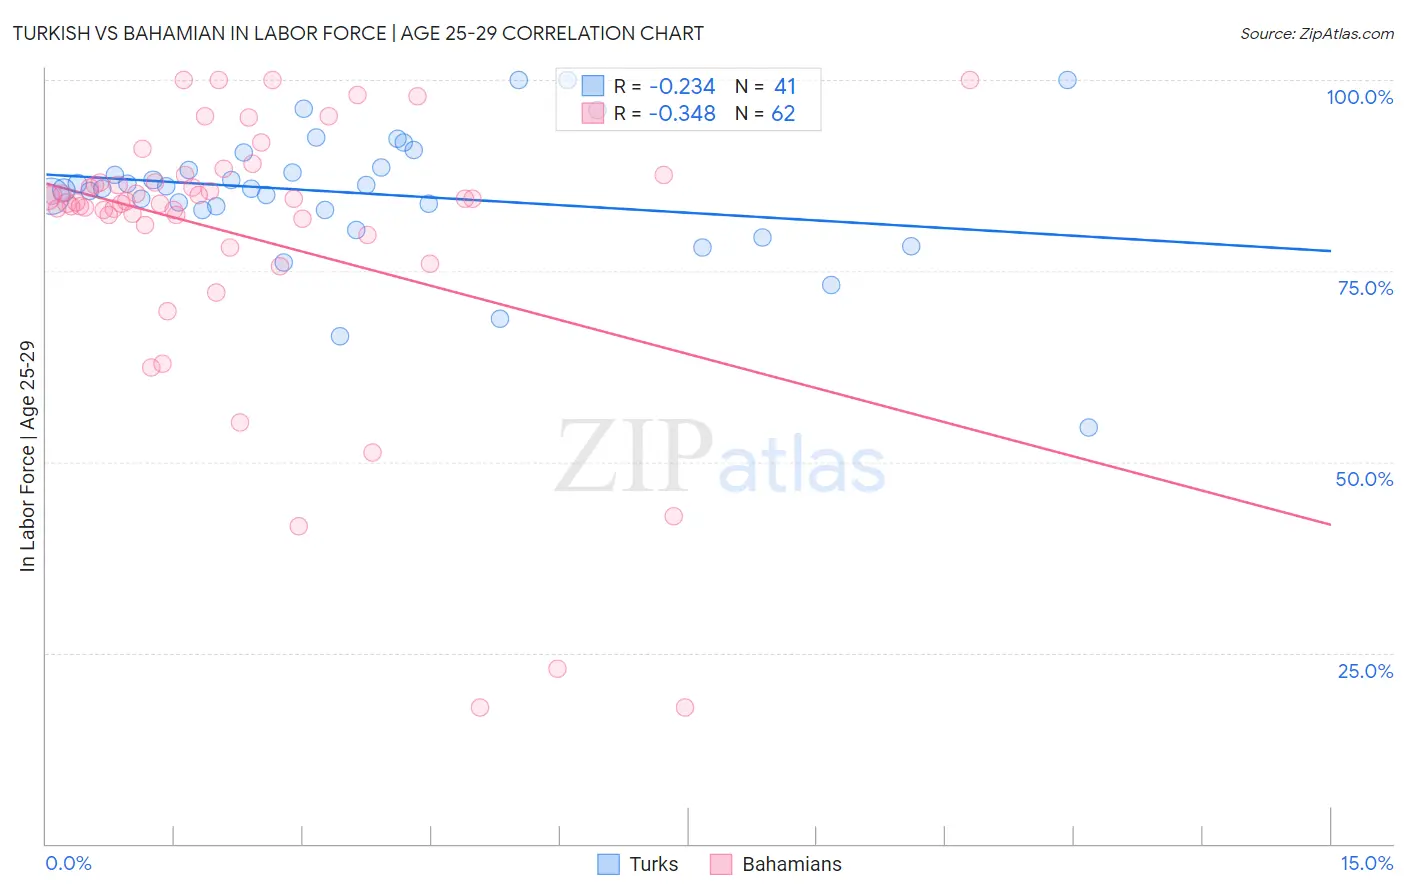
Turkish vs Bahamian In Labor Force | Age 25-29 Correlation Chart
The statistical analysis conducted on geographies consisting of 271,804,418 people shows a weak negative correlation between the proportion of Turks and labor force participation rate among population between the ages 25 and 29 in the United States with a correlation coefficient (R) of -0.234 and weighted average of 85.6%. Similarly, the statistical analysis conducted on geographies consisting of 112,690,388 people shows a mild negative correlation between the proportion of Bahamians and labor force participation rate among population between the ages 25 and 29 in the United States with a correlation coefficient (R) of -0.348 and weighted average of 83.7%, a difference of 2.3%.
In Labor Force | Age 25-29 Correlation Summary
| Measurement | Turkish | Bahamian |
| Minimum | 54.5% | 17.9% |
| Maximum | 100.0% | 100.0% |
| Range | 45.5% | 82.1% |
| Mean | 85.1% | 79.6% |
| Median | 85.8% | 84.1% |
| Interquartile 25% (IQ1) | 82.9% | 81.1% |
| Interquartile 75% (IQ3) | 89.5% | 86.5% |
| Interquartile Range (IQR) | 6.5% | 5.5% |
| Standard Deviation (Sample) | 8.8% | 18.2% |
| Standard Deviation (Population) | 8.7% | 18.0% |
Similar Demographics by In Labor Force | Age 25-29
Demographics Similar to Turks by In Labor Force | Age 25-29
In terms of in labor force | age 25-29, the demographic groups most similar to Turks are Italian (85.6%, a difference of 0.0%), Czech (85.6%, a difference of 0.020%), Swedish (85.6%, a difference of 0.020%), Yugoslavian (85.6%, a difference of 0.040%), and Immigrants from Latvia (85.6%, a difference of 0.050%).
| Demographics | Rating | Rank | In Labor Force | Age 25-29 |
| Immigrants | Albania | 99.9 /100 | #40 | Exceptional 85.7% |
| Immigrants | Greece | 99.9 /100 | #41 | Exceptional 85.7% |
| Immigrants | Eritrea | 99.9 /100 | #42 | Exceptional 85.7% |
| Immigrants | India | 99.9 /100 | #43 | Exceptional 85.7% |
| Macedonians | 99.9 /100 | #44 | Exceptional 85.7% |
| Immigrants | Sierra Leone | 99.9 /100 | #45 | Exceptional 85.7% |
| Czechs | 99.8 /100 | #46 | Exceptional 85.6% |
| Turks | 99.8 /100 | #47 | Exceptional 85.6% |
| Italians | 99.8 /100 | #48 | Exceptional 85.6% |
| Swedes | 99.8 /100 | #49 | Exceptional 85.6% |
| Yugoslavians | 99.8 /100 | #50 | Exceptional 85.6% |
| Immigrants | Latvia | 99.8 /100 | #51 | Exceptional 85.6% |
| Immigrants | Poland | 99.7 /100 | #52 | Exceptional 85.6% |
| Belgians | 99.7 /100 | #53 | Exceptional 85.5% |
| Albanians | 99.7 /100 | #54 | Exceptional 85.5% |
Demographics Similar to Bahamians by In Labor Force | Age 25-29
In terms of in labor force | age 25-29, the demographic groups most similar to Bahamians are Guatemalan (83.7%, a difference of 0.010%), Immigrants from Trinidad and Tobago (83.7%, a difference of 0.010%), Spaniard (83.7%, a difference of 0.010%), Central American (83.7%, a difference of 0.020%), and Hmong (83.7%, a difference of 0.030%).
| Demographics | Rating | Rank | In Labor Force | Age 25-29 |
| Immigrants | Jamaica | 0.4 /100 | #244 | Tragic 83.8% |
| Iroquois | 0.4 /100 | #245 | Tragic 83.8% |
| Cree | 0.3 /100 | #246 | Tragic 83.8% |
| Immigrants | El Salvador | 0.3 /100 | #247 | Tragic 83.7% |
| Immigrants | Nonimmigrants | 0.3 /100 | #248 | Tragic 83.7% |
| Hmong | 0.3 /100 | #249 | Tragic 83.7% |
| Central Americans | 0.2 /100 | #250 | Tragic 83.7% |
| Bahamians | 0.2 /100 | #251 | Tragic 83.7% |
| Guatemalans | 0.2 /100 | #252 | Tragic 83.7% |
| Immigrants | Trinidad and Tobago | 0.2 /100 | #253 | Tragic 83.7% |
| Spaniards | 0.2 /100 | #254 | Tragic 83.7% |
| Haitians | 0.2 /100 | #255 | Tragic 83.7% |
| Immigrants | Haiti | 0.2 /100 | #256 | Tragic 83.7% |
| Delaware | 0.2 /100 | #257 | Tragic 83.7% |
| Immigrants | Guatemala | 0.1 /100 | #258 | Tragic 83.6% |