South African vs Houma 8th Grade
COMPARE
South African
Houma
8th Grade
8th Grade Comparison
South Africans
Houma
96.4%
8TH GRADE
98.2/ 100
METRIC RATING
102nd/ 347
METRIC RANK
94.2%
8TH GRADE
0.0/ 100
METRIC RATING
294th/ 347
METRIC RANK
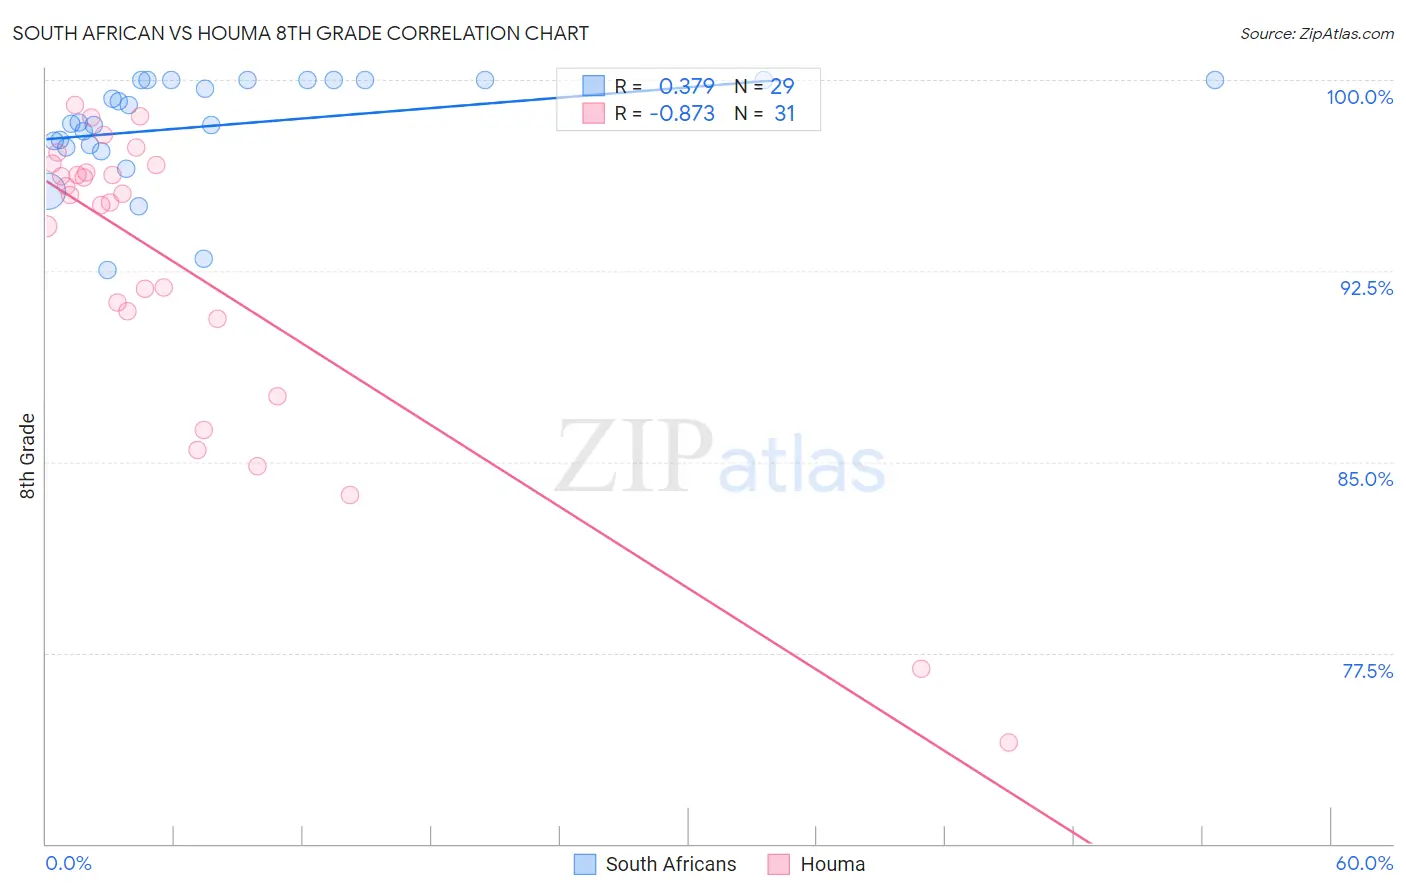
South African vs Houma 8th Grade Correlation Chart
The statistical analysis conducted on geographies consisting of 182,604,532 people shows a mild positive correlation between the proportion of South Africans and percentage of population with at least 8th grade education in the United States with a correlation coefficient (R) of 0.379 and weighted average of 96.4%. Similarly, the statistical analysis conducted on geographies consisting of 36,795,916 people shows a very strong negative correlation between the proportion of Houma and percentage of population with at least 8th grade education in the United States with a correlation coefficient (R) of -0.873 and weighted average of 94.2%, a difference of 2.3%.
8th Grade Correlation Summary
| Measurement | South African | Houma |
| Minimum | 92.5% | 74.0% |
| Maximum | 100.0% | 99.0% |
| Range | 7.5% | 25.0% |
| Mean | 98.2% | 92.6% |
| Median | 98.3% | 95.5% |
| Interquartile 25% (IQ1) | 97.4% | 90.6% |
| Interquartile 75% (IQ3) | 100.0% | 96.7% |
| Interquartile Range (IQR) | 2.6% | 6.0% |
| Standard Deviation (Sample) | 2.1% | 6.3% |
| Standard Deviation (Population) | 2.0% | 6.2% |
Similar Demographics by 8th Grade
Demographics Similar to South Africans by 8th Grade
In terms of 8th grade, the demographic groups most similar to South Africans are Bhutanese (96.4%, a difference of 0.010%), Immigrants from Saudi Arabia (96.3%, a difference of 0.010%), Kiowa (96.3%, a difference of 0.010%), Immigrants from North Macedonia (96.3%, a difference of 0.010%), and Okinawan (96.3%, a difference of 0.020%).
| Demographics | Rating | Rank | 8th Grade |
| German Russians | 98.8 /100 | #95 | Exceptional 96.4% |
| Potawatomi | 98.7 /100 | #96 | Exceptional 96.4% |
| Osage | 98.7 /100 | #97 | Exceptional 96.4% |
| Immigrants | Germany | 98.7 /100 | #98 | Exceptional 96.4% |
| Cree | 98.6 /100 | #99 | Exceptional 96.4% |
| Immigrants | Czechoslovakia | 98.6 /100 | #100 | Exceptional 96.4% |
| Bhutanese | 98.2 /100 | #101 | Exceptional 96.4% |
| South Africans | 98.2 /100 | #102 | Exceptional 96.4% |
| Immigrants | Saudi Arabia | 98.0 /100 | #103 | Exceptional 96.3% |
| Kiowa | 98.0 /100 | #104 | Exceptional 96.3% |
| Immigrants | North Macedonia | 98.0 /100 | #105 | Exceptional 96.3% |
| Okinawans | 98.0 /100 | #106 | Exceptional 96.3% |
| Immigrants | Latvia | 97.8 /100 | #107 | Exceptional 96.3% |
| Lebanese | 97.5 /100 | #108 | Exceptional 96.3% |
| Iroquois | 97.5 /100 | #109 | Exceptional 96.3% |
Demographics Similar to Houma by 8th Grade
In terms of 8th grade, the demographic groups most similar to Houma are Yaqui (94.2%, a difference of 0.0%), Fijian (94.2%, a difference of 0.010%), Bangladeshi (94.3%, a difference of 0.030%), Haitian (94.2%, a difference of 0.030%), and Immigrants from South Eastern Asia (94.2%, a difference of 0.040%).
| Demographics | Rating | Rank | 8th Grade |
| Tohono O'odham | 0.0 /100 | #287 | Tragic 94.5% |
| Malaysians | 0.0 /100 | #288 | Tragic 94.5% |
| British West Indians | 0.0 /100 | #289 | Tragic 94.4% |
| Immigrants | West Indies | 0.0 /100 | #290 | Tragic 94.3% |
| Immigrants | Grenada | 0.0 /100 | #291 | Tragic 94.3% |
| Bangladeshis | 0.0 /100 | #292 | Tragic 94.3% |
| Yaqui | 0.0 /100 | #293 | Tragic 94.2% |
| Houma | 0.0 /100 | #294 | Tragic 94.2% |
| Fijians | 0.0 /100 | #295 | Tragic 94.2% |
| Haitians | 0.0 /100 | #296 | Tragic 94.2% |
| Immigrants | South Eastern Asia | 0.0 /100 | #297 | Tragic 94.2% |
| Indonesians | 0.0 /100 | #298 | Tragic 94.1% |
| Cubans | 0.0 /100 | #299 | Tragic 94.1% |
| Immigrants | Burma/Myanmar | 0.0 /100 | #300 | Tragic 94.1% |
| Immigrants | Laos | 0.0 /100 | #301 | Tragic 94.1% |