Slavic vs Immigrants from Scotland In Labor Force | Age 20-24
COMPARE
Slavic
Immigrants from Scotland
In Labor Force | Age 20-24
In Labor Force | Age 20-24 Comparison
Slavs
Immigrants from Scotland
76.9%
IN LABOR FORCE | AGE 20-24
99.9/ 100
METRIC RATING
67th/ 347
METRIC RANK
75.8%
IN LABOR FORCE | AGE 20-24
93.7/ 100
METRIC RATING
125th/ 347
METRIC RANK
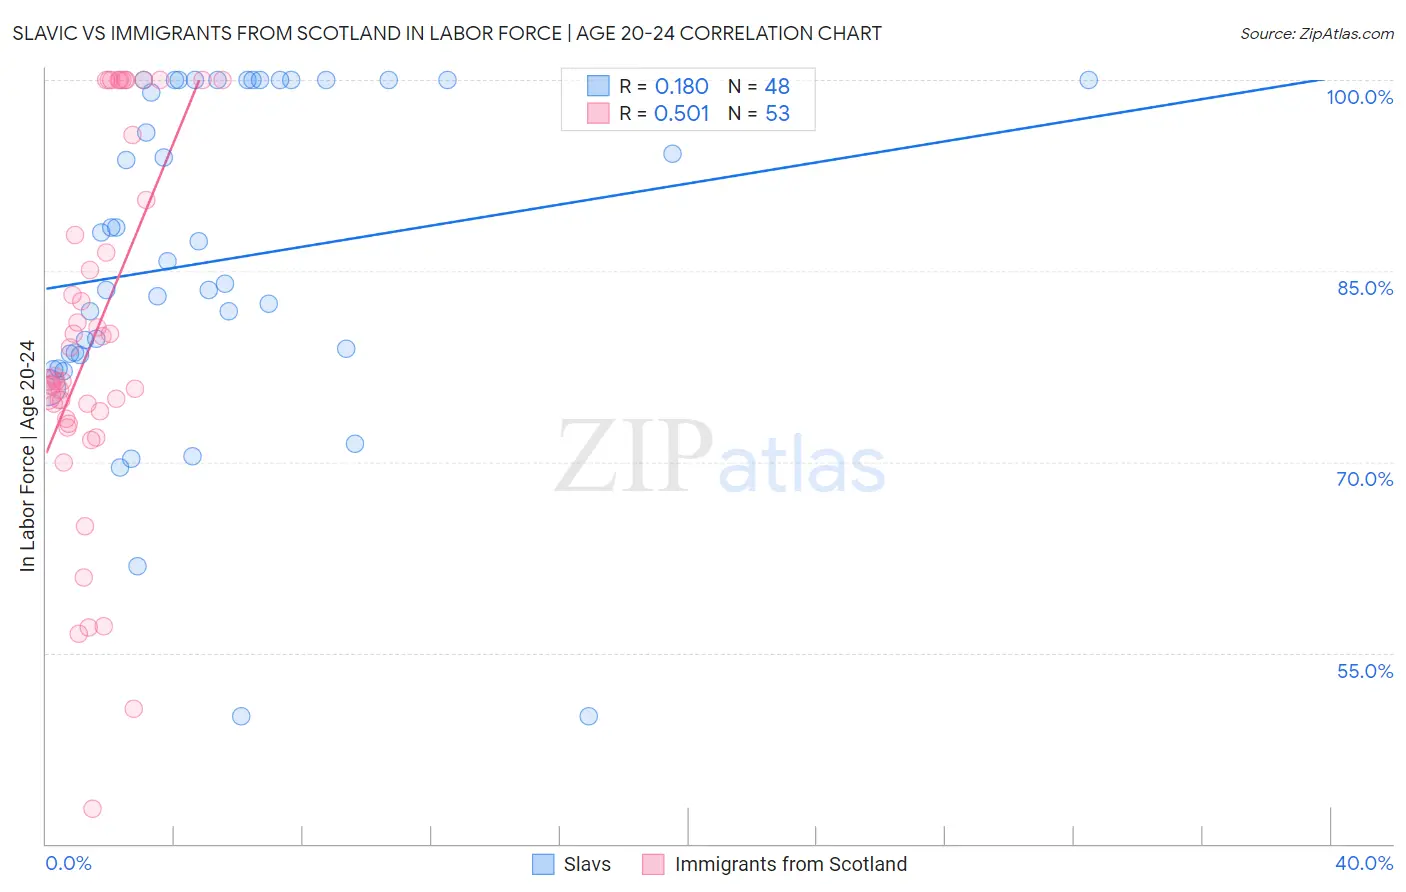
Slavic vs Immigrants from Scotland In Labor Force | Age 20-24 Correlation Chart
The statistical analysis conducted on geographies consisting of 270,816,892 people shows a poor positive correlation between the proportion of Slavs and labor force participation rate among population between the ages 20 and 24 in the United States with a correlation coefficient (R) of 0.180 and weighted average of 76.9%. Similarly, the statistical analysis conducted on geographies consisting of 196,345,554 people shows a substantial positive correlation between the proportion of Immigrants from Scotland and labor force participation rate among population between the ages 20 and 24 in the United States with a correlation coefficient (R) of 0.501 and weighted average of 75.8%, a difference of 1.4%.
In Labor Force | Age 20-24 Correlation Summary
| Measurement | Slavic | Immigrants from Scotland |
| Minimum | 50.0% | 42.7% |
| Maximum | 100.0% | 100.0% |
| Range | 50.0% | 57.3% |
| Mean | 85.8% | 80.1% |
| Median | 84.9% | 76.4% |
| Interquartile 25% (IQ1) | 78.5% | 73.7% |
| Interquartile 75% (IQ3) | 100.0% | 93.2% |
| Interquartile Range (IQR) | 21.5% | 19.5% |
| Standard Deviation (Sample) | 13.1% | 14.2% |
| Standard Deviation (Population) | 13.0% | 14.0% |
Similar Demographics by In Labor Force | Age 20-24
Demographics Similar to Slavs by In Labor Force | Age 20-24
In terms of in labor force | age 20-24, the demographic groups most similar to Slavs are Icelander (76.9%, a difference of 0.010%), Crow (76.9%, a difference of 0.020%), French American Indian (76.8%, a difference of 0.040%), Immigrants from Sudan (76.8%, a difference of 0.050%), and Ottawa (76.8%, a difference of 0.060%).
| Demographics | Rating | Rank | In Labor Force | Age 20-24 |
| Kenyans | 99.9 /100 | #60 | Exceptional 77.0% |
| Immigrants | Eritrea | 99.9 /100 | #61 | Exceptional 77.0% |
| Immigrants | Kenya | 99.9 /100 | #62 | Exceptional 77.0% |
| Lithuanians | 99.9 /100 | #63 | Exceptional 77.0% |
| Whites/Caucasians | 99.9 /100 | #64 | Exceptional 76.9% |
| Crow | 99.9 /100 | #65 | Exceptional 76.9% |
| Icelanders | 99.9 /100 | #66 | Exceptional 76.9% |
| Slavs | 99.9 /100 | #67 | Exceptional 76.9% |
| French American Indians | 99.8 /100 | #68 | Exceptional 76.8% |
| Immigrants | Sudan | 99.8 /100 | #69 | Exceptional 76.8% |
| Ottawa | 99.8 /100 | #70 | Exceptional 76.8% |
| Northern Europeans | 99.8 /100 | #71 | Exceptional 76.8% |
| Guamanians/Chamorros | 99.8 /100 | #72 | Exceptional 76.7% |
| British | 99.8 /100 | #73 | Exceptional 76.7% |
| Cree | 99.7 /100 | #74 | Exceptional 76.6% |
Demographics Similar to Immigrants from Scotland by In Labor Force | Age 20-24
In terms of in labor force | age 20-24, the demographic groups most similar to Immigrants from Scotland are Immigrants from Sierra Leone (75.8%, a difference of 0.010%), Pakistani (75.8%, a difference of 0.030%), Immigrants from Bulgaria (75.8%, a difference of 0.030%), Immigrants from Serbia (75.8%, a difference of 0.040%), and Brazilian (75.8%, a difference of 0.040%).
| Demographics | Rating | Rank | In Labor Force | Age 20-24 |
| Spanish Americans | 94.8 /100 | #118 | Exceptional 75.8% |
| Immigrants | Portugal | 94.8 /100 | #119 | Exceptional 75.8% |
| Immigrants | Africa | 94.6 /100 | #120 | Exceptional 75.8% |
| Immigrants | Serbia | 94.3 /100 | #121 | Exceptional 75.8% |
| Pakistanis | 94.1 /100 | #122 | Exceptional 75.8% |
| Immigrants | Bulgaria | 94.1 /100 | #123 | Exceptional 75.8% |
| Immigrants | Sierra Leone | 93.8 /100 | #124 | Exceptional 75.8% |
| Immigrants | Scotland | 93.7 /100 | #125 | Exceptional 75.8% |
| Brazilians | 93.0 /100 | #126 | Exceptional 75.8% |
| Sub-Saharan Africans | 90.9 /100 | #127 | Exceptional 75.7% |
| Immigrants | Afghanistan | 89.4 /100 | #128 | Excellent 75.6% |
| Iroquois | 89.1 /100 | #129 | Excellent 75.6% |
| Immigrants | Austria | 88.8 /100 | #130 | Excellent 75.6% |
| Immigrants | Jordan | 88.5 /100 | #131 | Excellent 75.6% |
| Palestinians | 88.4 /100 | #132 | Excellent 75.6% |