Guatemalan vs Apache In Labor Force | Age 16-19
COMPARE
Guatemalan
Apache
In Labor Force | Age 16-19
In Labor Force | Age 16-19 Comparison
Guatemalans
Apache
35.5%
IN LABOR FORCE | AGE 16-19
8.6/ 100
METRIC RATING
219th/ 347
METRIC RANK
35.6%
IN LABOR FORCE | AGE 16-19
11.0/ 100
METRIC RATING
214th/ 347
METRIC RANK
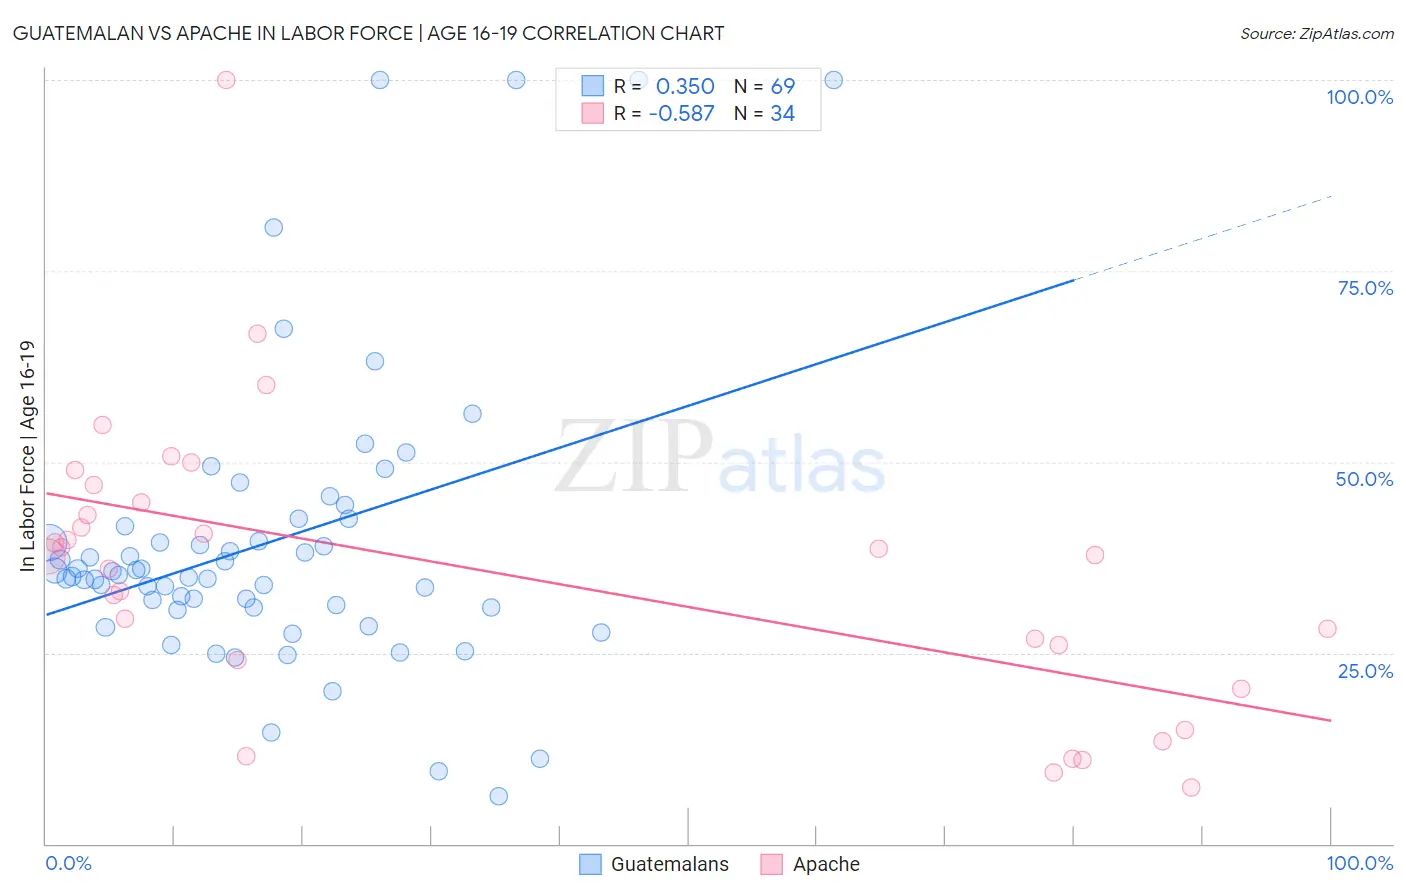
Guatemalan vs Apache In Labor Force | Age 16-19 Correlation Chart
The statistical analysis conducted on geographies consisting of 409,132,504 people shows a mild positive correlation between the proportion of Guatemalans and labor force participation rate among population between the ages 16 and 19 in the United States with a correlation coefficient (R) of 0.350 and weighted average of 35.5%. Similarly, the statistical analysis conducted on geographies consisting of 230,841,914 people shows a substantial negative correlation between the proportion of Apache and labor force participation rate among population between the ages 16 and 19 in the United States with a correlation coefficient (R) of -0.587 and weighted average of 35.6%, a difference of 0.35%.
In Labor Force | Age 16-19 Correlation Summary
| Measurement | Guatemalan | Apache |
| Minimum | 6.3% | 7.4% |
| Maximum | 100.0% | 100.0% |
| Range | 93.7% | 92.6% |
| Mean | 39.5% | 35.7% |
| Median | 35.2% | 37.7% |
| Interquartile 25% (IQ1) | 30.9% | 24.0% |
| Interquartile 75% (IQ3) | 42.1% | 44.6% |
| Interquartile Range (IQR) | 11.2% | 20.6% |
| Standard Deviation (Sample) | 19.2% | 19.0% |
| Standard Deviation (Population) | 19.1% | 18.7% |
Demographics Similar to Guatemalans and Apache by In Labor Force | Age 16-19
In terms of in labor force | age 16-19, the demographic groups most similar to Guatemalans are Immigrants from Bahamas (35.5%, a difference of 0.060%), Sri Lankan (35.5%, a difference of 0.18%), Turkish (35.4%, a difference of 0.23%), Immigrants from Ghana (35.4%, a difference of 0.24%), and Dutch West Indian (35.6%, a difference of 0.30%). Similarly, the demographic groups most similar to Apache are Houma (35.6%, a difference of 0.010%), Immigrants from Bolivia (35.6%, a difference of 0.010%), Immigrants from South Eastern Asia (35.6%, a difference of 0.020%), Dutch West Indian (35.6%, a difference of 0.040%), and Immigrants from Costa Rica (35.6%, a difference of 0.040%).
| Demographics | Rating | Rank | In Labor Force | Age 16-19 |
| Chileans | 14.6 /100 | #206 | Poor 35.8% |
| Immigrants | Eastern Europe | 14.5 /100 | #207 | Poor 35.8% |
| Koreans | 13.3 /100 | #208 | Poor 35.7% |
| Moroccans | 12.7 /100 | #209 | Poor 35.7% |
| Immigrants | Switzerland | 11.9 /100 | #210 | Poor 35.6% |
| Mexicans | 11.9 /100 | #211 | Poor 35.6% |
| Houma | 11.0 /100 | #212 | Poor 35.6% |
| Immigrants | Bolivia | 11.0 /100 | #213 | Poor 35.6% |
| Apache | 11.0 /100 | #214 | Poor 35.6% |
| Immigrants | South Eastern Asia | 10.8 /100 | #215 | Poor 35.6% |
| Dutch West Indians | 10.7 /100 | #216 | Poor 35.6% |
| Immigrants | Costa Rica | 10.7 /100 | #217 | Poor 35.6% |
| Sri Lankans | 9.8 /100 | #218 | Tragic 35.5% |
| Guatemalans | 8.6 /100 | #219 | Tragic 35.5% |
| Immigrants | Bahamas | 8.3 /100 | #220 | Tragic 35.5% |
| Turks | 7.3 /100 | #221 | Tragic 35.4% |
| Immigrants | Ghana | 7.3 /100 | #222 | Tragic 35.4% |
| Ghanaians | 6.5 /100 | #223 | Tragic 35.3% |
| Hondurans | 6.5 /100 | #224 | Tragic 35.3% |
| Immigrants | Belgium | 6.1 /100 | #225 | Tragic 35.3% |
| Immigrants | Guatemala | 5.7 /100 | #226 | Tragic 35.3% |