Immigrants from Japan vs U.S. Virgin Islander In Labor Force | Age 20-24
COMPARE
Immigrants from Japan
U.S. Virgin Islander
In Labor Force | Age 20-24
In Labor Force | Age 20-24 Comparison
Immigrants from Japan
U.S. Virgin Islanders
74.1%
IN LABOR FORCE | AGE 20-24
3.0/ 100
METRIC RATING
238th/ 347
METRIC RANK
73.0%
IN LABOR FORCE | AGE 20-24
0.1/ 100
METRIC RATING
289th/ 347
METRIC RANK
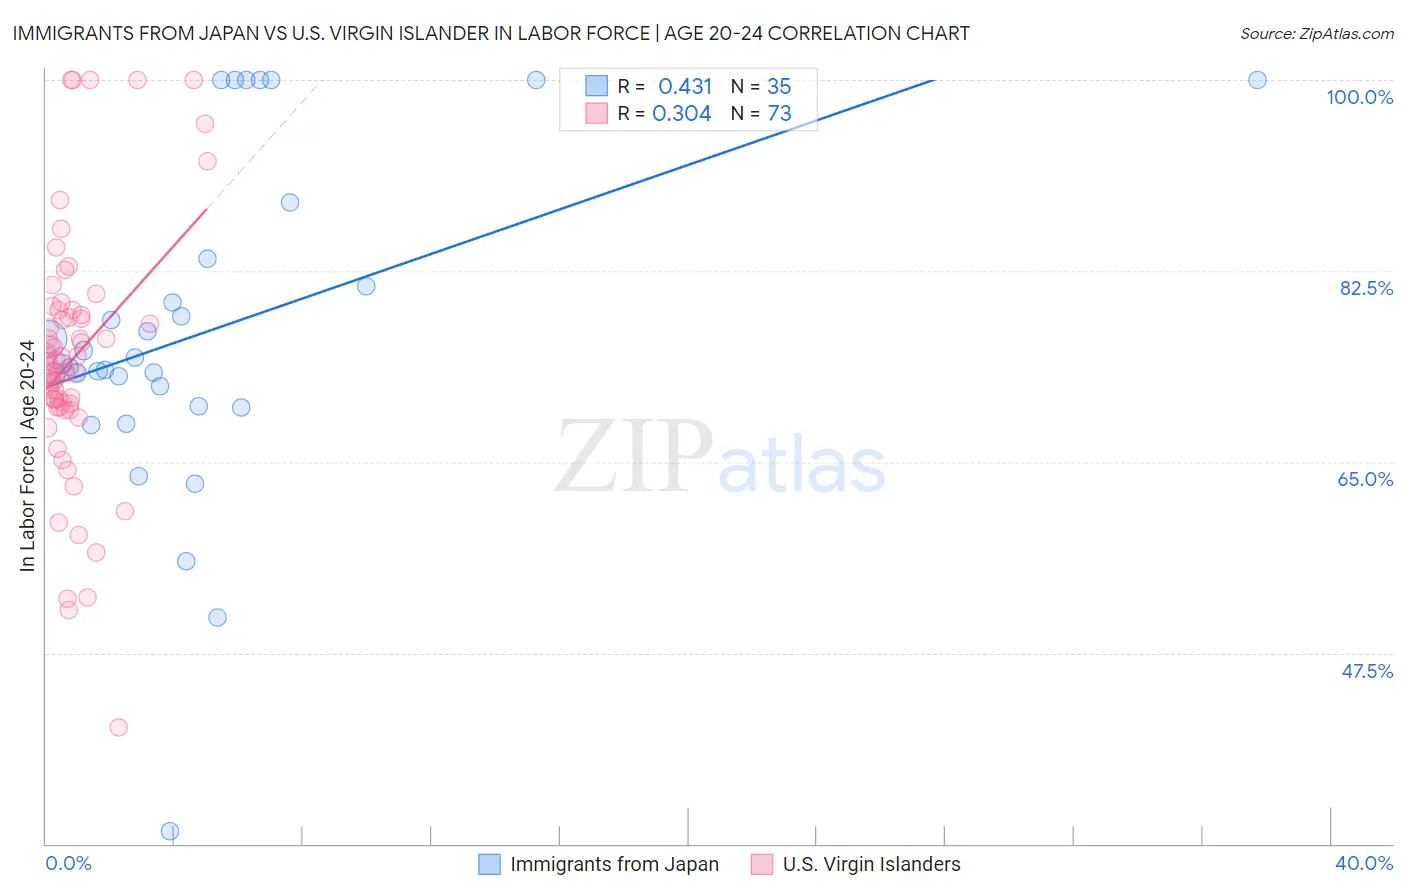
Immigrants from Japan vs U.S. Virgin Islander In Labor Force | Age 20-24 Correlation Chart
The statistical analysis conducted on geographies consisting of 340,014,549 people shows a moderate positive correlation between the proportion of Immigrants from Japan and labor force participation rate among population between the ages 20 and 24 in the United States with a correlation coefficient (R) of 0.431 and weighted average of 74.1%. Similarly, the statistical analysis conducted on geographies consisting of 87,526,694 people shows a mild positive correlation between the proportion of U.S. Virgin Islanders and labor force participation rate among population between the ages 20 and 24 in the United States with a correlation coefficient (R) of 0.304 and weighted average of 73.0%, a difference of 1.4%.
In Labor Force | Age 20-24 Correlation Summary
| Measurement | Immigrants from Japan | U.S. Virgin Islander |
| Minimum | 31.2% | 40.7% |
| Maximum | 100.0% | 100.0% |
| Range | 68.8% | 59.3% |
| Mean | 76.9% | 74.5% |
| Median | 74.0% | 73.8% |
| Interquartile 25% (IQ1) | 70.1% | 70.2% |
| Interquartile 75% (IQ3) | 83.6% | 78.7% |
| Interquartile Range (IQR) | 13.5% | 8.5% |
| Standard Deviation (Sample) | 15.3% | 11.3% |
| Standard Deviation (Population) | 15.0% | 11.2% |
Similar Demographics by In Labor Force | Age 20-24
Demographics Similar to Immigrants from Japan by In Labor Force | Age 20-24
In terms of in labor force | age 20-24, the demographic groups most similar to Immigrants from Japan are Bermudan (74.1%, a difference of 0.030%), Immigrants from France (74.1%, a difference of 0.040%), Immigrants from Latin America (74.1%, a difference of 0.040%), Laotian (74.1%, a difference of 0.060%), and Immigrants (74.1%, a difference of 0.070%).
| Demographics | Rating | Rank | In Labor Force | Age 20-24 |
| Immigrants | Greece | 4.1 /100 | #231 | Tragic 74.2% |
| Immigrants | Switzerland | 4.1 /100 | #232 | Tragic 74.2% |
| Immigrants | Chile | 3.7 /100 | #233 | Tragic 74.1% |
| Immigrants | Immigrants | 3.6 /100 | #234 | Tragic 74.1% |
| Laotians | 3.5 /100 | #235 | Tragic 74.1% |
| Immigrants | France | 3.3 /100 | #236 | Tragic 74.1% |
| Bermudans | 3.2 /100 | #237 | Tragic 74.1% |
| Immigrants | Japan | 3.0 /100 | #238 | Tragic 74.1% |
| Immigrants | Latin America | 2.7 /100 | #239 | Tragic 74.1% |
| Immigrants | Sri Lanka | 2.3 /100 | #240 | Tragic 74.0% |
| Immigrants | Senegal | 2.1 /100 | #241 | Tragic 74.0% |
| Thais | 2.1 /100 | #242 | Tragic 74.0% |
| Immigrants | Syria | 1.9 /100 | #243 | Tragic 74.0% |
| Immigrants | South Central Asia | 1.9 /100 | #244 | Tragic 74.0% |
| Turks | 1.8 /100 | #245 | Tragic 73.9% |
Demographics Similar to U.S. Virgin Islanders by In Labor Force | Age 20-24
In terms of in labor force | age 20-24, the demographic groups most similar to U.S. Virgin Islanders are Argentinean (73.1%, a difference of 0.030%), Immigrants from Belarus (73.0%, a difference of 0.080%), Immigrants from Korea (73.1%, a difference of 0.11%), Immigrants from Lebanon (73.1%, a difference of 0.13%), and Immigrants from Nicaragua (72.9%, a difference of 0.15%).
| Demographics | Rating | Rank | In Labor Force | Age 20-24 |
| Immigrants | Spain | 0.1 /100 | #282 | Tragic 73.2% |
| Immigrants | Bahamas | 0.1 /100 | #283 | Tragic 73.2% |
| Kiowa | 0.1 /100 | #284 | Tragic 73.2% |
| Nicaraguans | 0.1 /100 | #285 | Tragic 73.2% |
| Immigrants | Lebanon | 0.1 /100 | #286 | Tragic 73.1% |
| Immigrants | Korea | 0.1 /100 | #287 | Tragic 73.1% |
| Argentineans | 0.1 /100 | #288 | Tragic 73.1% |
| U.S. Virgin Islanders | 0.1 /100 | #289 | Tragic 73.0% |
| Immigrants | Belarus | 0.1 /100 | #290 | Tragic 73.0% |
| Immigrants | Nicaragua | 0.0 /100 | #291 | Tragic 72.9% |
| Pueblo | 0.0 /100 | #292 | Tragic 72.9% |
| Immigrants | Belize | 0.0 /100 | #293 | Tragic 72.8% |
| Immigrants | Argentina | 0.0 /100 | #294 | Tragic 72.8% |
| Okinawans | 0.0 /100 | #295 | Tragic 72.7% |
| Jamaicans | 0.0 /100 | #296 | Tragic 72.7% |