Immigrants from Western Europe vs U.S. Virgin Islander In Labor Force | Age 20-24
COMPARE
Immigrants from Western Europe
U.S. Virgin Islander
In Labor Force | Age 20-24
In Labor Force | Age 20-24 Comparison
Immigrants from Western Europe
U.S. Virgin Islanders
75.3%
IN LABOR FORCE | AGE 20-24
71.5/ 100
METRIC RATING
157th/ 347
METRIC RANK
73.0%
IN LABOR FORCE | AGE 20-24
0.1/ 100
METRIC RATING
289th/ 347
METRIC RANK
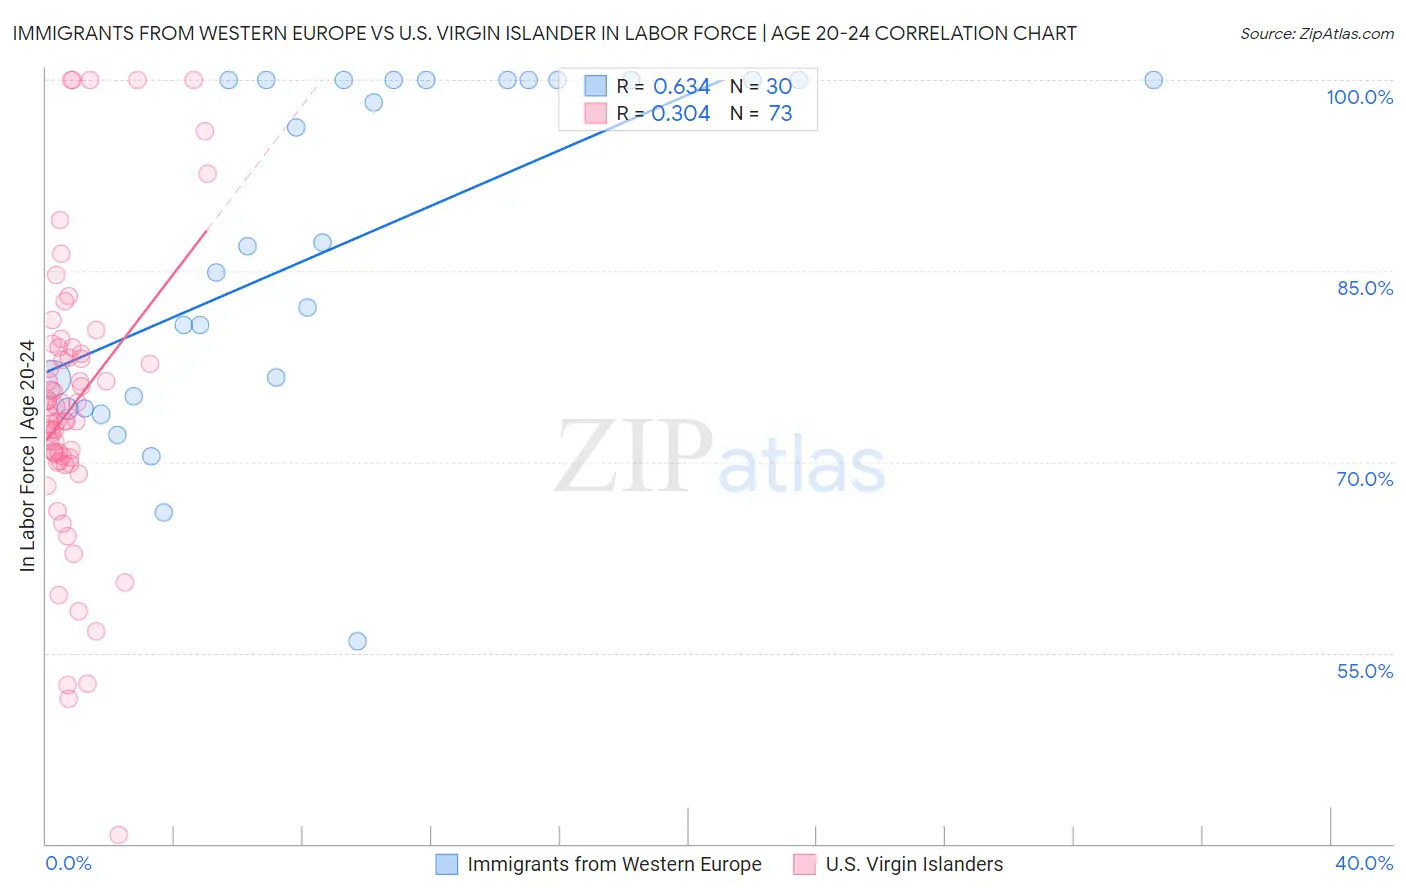
Immigrants from Western Europe vs U.S. Virgin Islander In Labor Force | Age 20-24 Correlation Chart
The statistical analysis conducted on geographies consisting of 493,597,836 people shows a significant positive correlation between the proportion of Immigrants from Western Europe and labor force participation rate among population between the ages 20 and 24 in the United States with a correlation coefficient (R) of 0.634 and weighted average of 75.3%. Similarly, the statistical analysis conducted on geographies consisting of 87,526,694 people shows a mild positive correlation between the proportion of U.S. Virgin Islanders and labor force participation rate among population between the ages 20 and 24 in the United States with a correlation coefficient (R) of 0.304 and weighted average of 73.0%, a difference of 3.1%.
In Labor Force | Age 20-24 Correlation Summary
| Measurement | Immigrants from Western Europe | U.S. Virgin Islander |
| Minimum | 55.9% | 40.7% |
| Maximum | 100.0% | 100.0% |
| Range | 44.1% | 59.3% |
| Mean | 87.1% | 74.5% |
| Median | 87.1% | 73.8% |
| Interquartile 25% (IQ1) | 75.1% | 70.2% |
| Interquartile 75% (IQ3) | 100.0% | 78.7% |
| Interquartile Range (IQR) | 24.9% | 8.5% |
| Standard Deviation (Sample) | 13.3% | 11.3% |
| Standard Deviation (Population) | 13.1% | 11.2% |
Similar Demographics by In Labor Force | Age 20-24
Demographics Similar to Immigrants from Western Europe by In Labor Force | Age 20-24
In terms of in labor force | age 20-24, the demographic groups most similar to Immigrants from Western Europe are Immigrants from El Salvador (75.3%, a difference of 0.0%), Guatemalan (75.3%, a difference of 0.010%), Osage (75.3%, a difference of 0.010%), Immigrants from Guatemala (75.3%, a difference of 0.010%), and Immigrants from Bolivia (75.3%, a difference of 0.010%).
| Demographics | Rating | Rank | In Labor Force | Age 20-24 |
| Salvadorans | 74.8 /100 | #150 | Good 75.3% |
| Paiute | 74.1 /100 | #151 | Good 75.3% |
| Lebanese | 73.5 /100 | #152 | Good 75.3% |
| Guatemalans | 72.3 /100 | #153 | Good 75.3% |
| Osage | 72.3 /100 | #154 | Good 75.3% |
| Immigrants | Guatemala | 71.9 /100 | #155 | Good 75.3% |
| Immigrants | El Salvador | 71.7 /100 | #156 | Good 75.3% |
| Immigrants | Western Europe | 71.5 /100 | #157 | Good 75.3% |
| Immigrants | Bolivia | 71.0 /100 | #158 | Good 75.3% |
| South American Indians | 69.0 /100 | #159 | Good 75.3% |
| Japanese | 68.7 /100 | #160 | Good 75.3% |
| New Zealanders | 65.4 /100 | #161 | Good 75.2% |
| Immigrants | Romania | 64.6 /100 | #162 | Good 75.2% |
| Costa Ricans | 64.2 /100 | #163 | Good 75.2% |
| Bolivians | 64.0 /100 | #164 | Good 75.2% |
Demographics Similar to U.S. Virgin Islanders by In Labor Force | Age 20-24
In terms of in labor force | age 20-24, the demographic groups most similar to U.S. Virgin Islanders are Argentinean (73.1%, a difference of 0.030%), Immigrants from Belarus (73.0%, a difference of 0.080%), Immigrants from Korea (73.1%, a difference of 0.11%), Immigrants from Lebanon (73.1%, a difference of 0.13%), and Immigrants from Nicaragua (72.9%, a difference of 0.15%).
| Demographics | Rating | Rank | In Labor Force | Age 20-24 |
| Immigrants | Spain | 0.1 /100 | #282 | Tragic 73.2% |
| Immigrants | Bahamas | 0.1 /100 | #283 | Tragic 73.2% |
| Kiowa | 0.1 /100 | #284 | Tragic 73.2% |
| Nicaraguans | 0.1 /100 | #285 | Tragic 73.2% |
| Immigrants | Lebanon | 0.1 /100 | #286 | Tragic 73.1% |
| Immigrants | Korea | 0.1 /100 | #287 | Tragic 73.1% |
| Argentineans | 0.1 /100 | #288 | Tragic 73.1% |
| U.S. Virgin Islanders | 0.1 /100 | #289 | Tragic 73.0% |
| Immigrants | Belarus | 0.1 /100 | #290 | Tragic 73.0% |
| Immigrants | Nicaragua | 0.0 /100 | #291 | Tragic 72.9% |
| Pueblo | 0.0 /100 | #292 | Tragic 72.9% |
| Immigrants | Belize | 0.0 /100 | #293 | Tragic 72.8% |
| Immigrants | Argentina | 0.0 /100 | #294 | Tragic 72.8% |
| Okinawans | 0.0 /100 | #295 | Tragic 72.7% |
| Jamaicans | 0.0 /100 | #296 | Tragic 72.7% |