Immigrants from Nicaragua vs Immigrants from Yemen In Labor Force | Age 25-29
COMPARE
Immigrants from Nicaragua
Immigrants from Yemen
In Labor Force | Age 25-29
In Labor Force | Age 25-29 Comparison
Immigrants from Nicaragua
Immigrants from Yemen
82.9%
IN LABOR FORCE | AGE 25-29
0.0/ 100
METRIC RATING
296th/ 347
METRIC RANK
78.2%
IN LABOR FORCE | AGE 25-29
0.0/ 100
METRIC RATING
339th/ 347
METRIC RANK
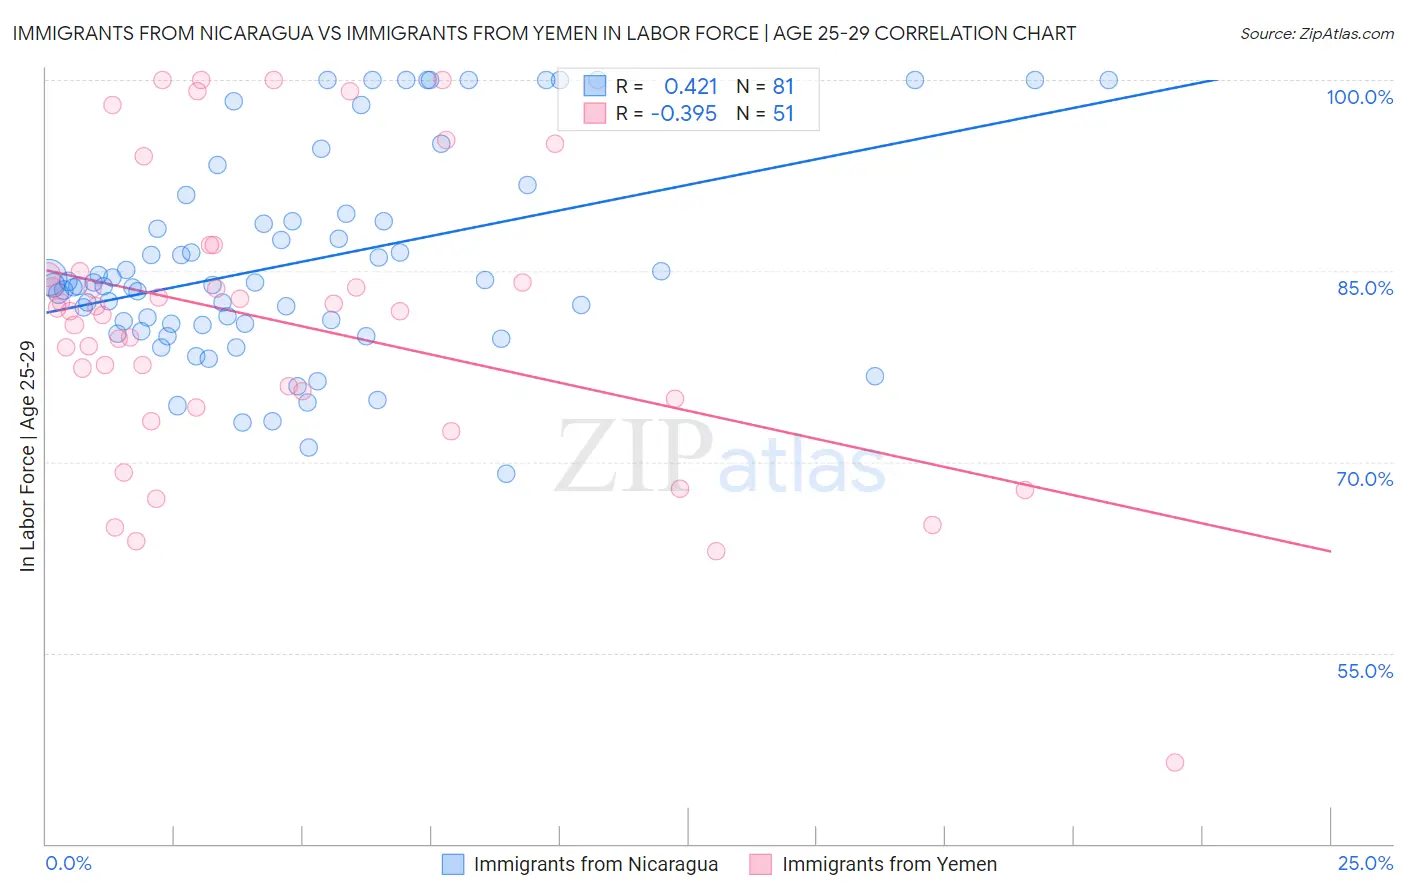
Immigrants from Nicaragua vs Immigrants from Yemen In Labor Force | Age 25-29 Correlation Chart
The statistical analysis conducted on geographies consisting of 236,313,358 people shows a moderate positive correlation between the proportion of Immigrants from Nicaragua and labor force participation rate among population between the ages 25 and 29 in the United States with a correlation coefficient (R) of 0.421 and weighted average of 82.9%. Similarly, the statistical analysis conducted on geographies consisting of 82,433,611 people shows a mild negative correlation between the proportion of Immigrants from Yemen and labor force participation rate among population between the ages 25 and 29 in the United States with a correlation coefficient (R) of -0.395 and weighted average of 78.2%, a difference of 6.0%.
In Labor Force | Age 25-29 Correlation Summary
| Measurement | Immigrants from Nicaragua | Immigrants from Yemen |
| Minimum | 69.1% | 46.4% |
| Maximum | 100.0% | 100.0% |
| Range | 30.9% | 53.6% |
| Mean | 85.7% | 81.1% |
| Median | 83.9% | 81.9% |
| Interquartile 25% (IQ1) | 80.8% | 75.0% |
| Interquartile 75% (IQ3) | 89.2% | 85.0% |
| Interquartile Range (IQR) | 8.4% | 10.0% |
| Standard Deviation (Sample) | 8.0% | 11.4% |
| Standard Deviation (Population) | 8.0% | 11.2% |
Similar Demographics by In Labor Force | Age 25-29
Demographics Similar to Immigrants from Nicaragua by In Labor Force | Age 25-29
In terms of in labor force | age 25-29, the demographic groups most similar to Immigrants from Nicaragua are Nepalese (82.9%, a difference of 0.0%), Chippewa (82.9%, a difference of 0.0%), Potawatomi (82.9%, a difference of 0.0%), Immigrants from Latin America (82.9%, a difference of 0.010%), and Native Hawaiian (82.9%, a difference of 0.010%).
| Demographics | Rating | Rank | In Labor Force | Age 25-29 |
| Immigrants | Micronesia | 0.0 /100 | #289 | Tragic 83.0% |
| Immigrants | Bangladesh | 0.0 /100 | #290 | Tragic 83.0% |
| Hawaiians | 0.0 /100 | #291 | Tragic 83.0% |
| Immigrants | Guyana | 0.0 /100 | #292 | Tragic 83.0% |
| Immigrants | Latin America | 0.0 /100 | #293 | Tragic 82.9% |
| Nepalese | 0.0 /100 | #294 | Tragic 82.9% |
| Chippewa | 0.0 /100 | #295 | Tragic 82.9% |
| Immigrants | Nicaragua | 0.0 /100 | #296 | Tragic 82.9% |
| Potawatomi | 0.0 /100 | #297 | Tragic 82.9% |
| Native Hawaiians | 0.0 /100 | #298 | Tragic 82.9% |
| Fijians | 0.0 /100 | #299 | Tragic 82.9% |
| Spanish American Indians | 0.0 /100 | #300 | Tragic 82.9% |
| Vietnamese | 0.0 /100 | #301 | Tragic 82.8% |
| Immigrants | Belize | 0.0 /100 | #302 | Tragic 82.8% |
| Immigrants | Grenada | 0.0 /100 | #303 | Tragic 82.8% |
Demographics Similar to Immigrants from Yemen by In Labor Force | Age 25-29
In terms of in labor force | age 25-29, the demographic groups most similar to Immigrants from Yemen are Lumbee (78.3%, a difference of 0.12%), Paiute (78.1%, a difference of 0.16%), Crow (78.6%, a difference of 0.49%), Tohono O'odham (77.5%, a difference of 0.94%), and Pueblo (77.5%, a difference of 0.96%).
| Demographics | Rating | Rank | In Labor Force | Age 25-29 |
| Inupiat | 0.0 /100 | #332 | Tragic 79.8% |
| Sioux | 0.0 /100 | #333 | Tragic 79.7% |
| Yuman | 0.0 /100 | #334 | Tragic 79.3% |
| Natives/Alaskans | 0.0 /100 | #335 | Tragic 79.3% |
| Apache | 0.0 /100 | #336 | Tragic 79.2% |
| Crow | 0.0 /100 | #337 | Tragic 78.6% |
| Lumbee | 0.0 /100 | #338 | Tragic 78.3% |
| Immigrants | Yemen | 0.0 /100 | #339 | Tragic 78.2% |
| Paiute | 0.0 /100 | #340 | Tragic 78.1% |
| Tohono O'odham | 0.0 /100 | #341 | Tragic 77.5% |
| Pueblo | 0.0 /100 | #342 | Tragic 77.5% |
| Arapaho | 0.0 /100 | #343 | Tragic 76.6% |
| Hopi | 0.0 /100 | #344 | Tragic 76.5% |
| Navajo | 0.0 /100 | #345 | Tragic 74.6% |
| Pima | 0.0 /100 | #346 | Tragic 74.3% |