Cuban vs Immigrants from Caribbean In Labor Force | Age 30-34
COMPARE
Cuban
Immigrants from Caribbean
In Labor Force | Age 30-34
In Labor Force | Age 30-34 Comparison
Cubans
Immigrants from Caribbean
84.2%
IN LABOR FORCE | AGE 30-34
3.4/ 100
METRIC RATING
224th/ 347
METRIC RANK
84.0%
IN LABOR FORCE | AGE 30-34
1.1/ 100
METRIC RATING
243rd/ 347
METRIC RANK
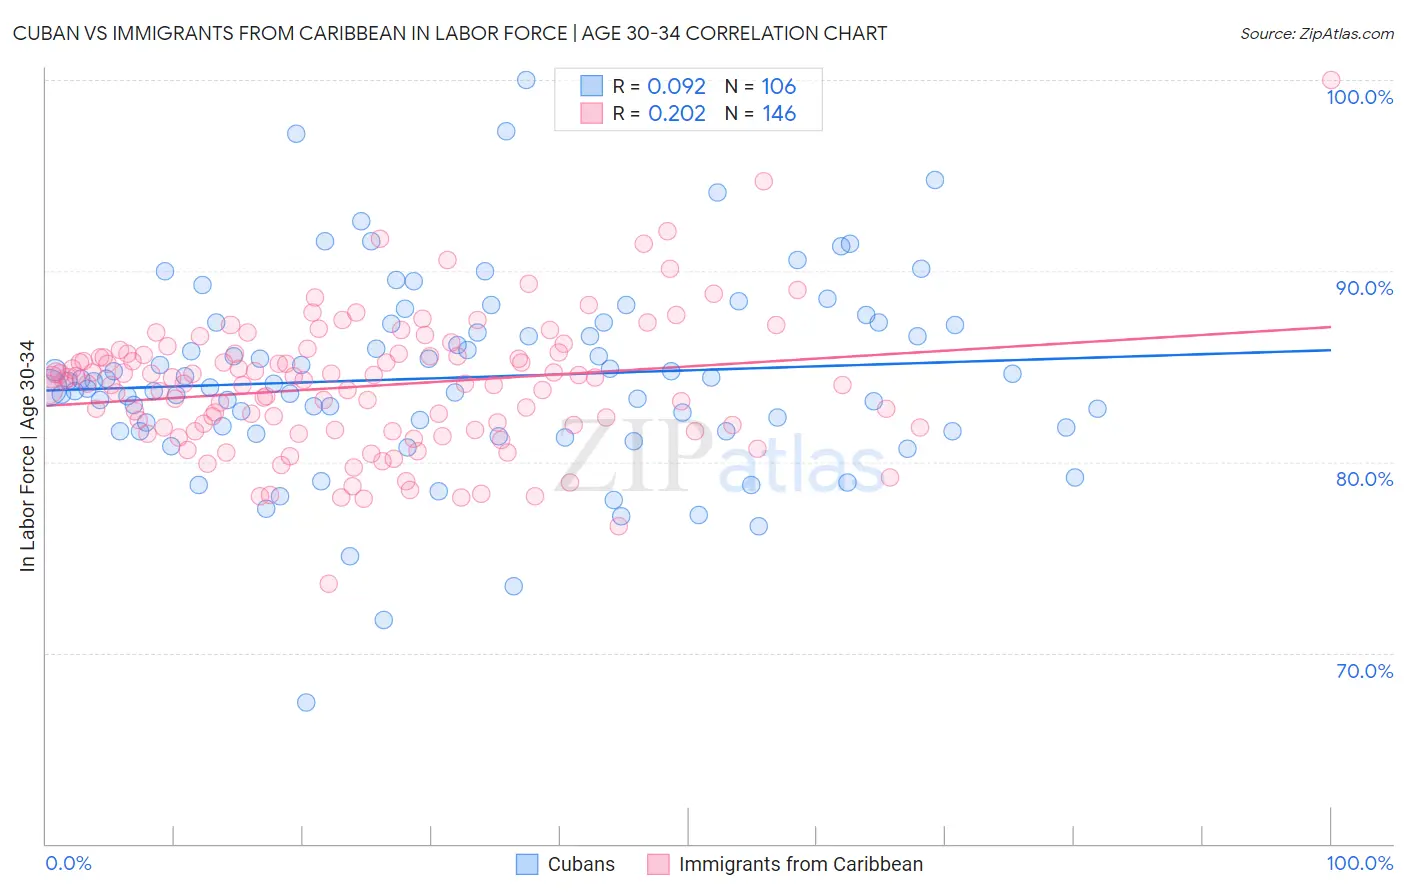
Cuban vs Immigrants from Caribbean In Labor Force | Age 30-34 Correlation Chart
The statistical analysis conducted on geographies consisting of 448,964,387 people shows a slight positive correlation between the proportion of Cubans and labor force participation rate among population between the ages 30 and 34 in the United States with a correlation coefficient (R) of 0.092 and weighted average of 84.2%. Similarly, the statistical analysis conducted on geographies consisting of 449,684,451 people shows a weak positive correlation between the proportion of Immigrants from Caribbean and labor force participation rate among population between the ages 30 and 34 in the United States with a correlation coefficient (R) of 0.202 and weighted average of 84.0%, a difference of 0.20%.
In Labor Force | Age 30-34 Correlation Summary
| Measurement | Cuban | Immigrants from Caribbean |
| Minimum | 67.4% | 73.6% |
| Maximum | 100.0% | 100.0% |
| Range | 32.6% | 26.4% |
| Mean | 84.4% | 84.0% |
| Median | 84.1% | 84.2% |
| Interquartile 25% (IQ1) | 81.6% | 81.6% |
| Interquartile 75% (IQ3) | 87.3% | 85.6% |
| Interquartile Range (IQR) | 5.6% | 4.0% |
| Standard Deviation (Sample) | 5.1% | 3.5% |
| Standard Deviation (Population) | 5.1% | 3.5% |
Demographics Similar to Cubans and Immigrants from Caribbean by In Labor Force | Age 30-34
In terms of in labor force | age 30-34, the demographic groups most similar to Cubans are Immigrants from Laos (84.2%, a difference of 0.010%), Scottish (84.2%, a difference of 0.020%), Immigrants from El Salvador (84.2%, a difference of 0.020%), Immigrants from Cuba (84.2%, a difference of 0.020%), and Immigrants from Haiti (84.2%, a difference of 0.030%). Similarly, the demographic groups most similar to Immigrants from Caribbean are Immigrants from Oceania (84.0%, a difference of 0.010%), Immigrants from Portugal (84.0%, a difference of 0.020%), Immigrants from Barbados (84.0%, a difference of 0.040%), English (84.0%, a difference of 0.040%), and Venezuelan (84.0%, a difference of 0.040%).
| Demographics | Rating | Rank | In Labor Force | Age 30-34 |
| Immigrants | Laos | 3.6 /100 | #223 | Tragic 84.2% |
| Cubans | 3.4 /100 | #224 | Tragic 84.2% |
| Scottish | 3.1 /100 | #225 | Tragic 84.2% |
| Immigrants | El Salvador | 3.0 /100 | #226 | Tragic 84.2% |
| Immigrants | Cuba | 3.0 /100 | #227 | Tragic 84.2% |
| Immigrants | Haiti | 2.8 /100 | #228 | Tragic 84.2% |
| Welsh | 2.7 /100 | #229 | Tragic 84.2% |
| Immigrants | Bahamas | 2.6 /100 | #230 | Tragic 84.1% |
| Malaysians | 2.2 /100 | #231 | Tragic 84.1% |
| Immigrants | Immigrants | 2.0 /100 | #232 | Tragic 84.1% |
| West Indians | 1.9 /100 | #233 | Tragic 84.1% |
| Haitians | 1.8 /100 | #234 | Tragic 84.1% |
| French American Indians | 1.7 /100 | #235 | Tragic 84.1% |
| U.S. Virgin Islanders | 1.5 /100 | #236 | Tragic 84.1% |
| Celtics | 1.4 /100 | #237 | Tragic 84.1% |
| Immigrants | Barbados | 1.4 /100 | #238 | Tragic 84.0% |
| English | 1.4 /100 | #239 | Tragic 84.0% |
| Venezuelans | 1.3 /100 | #240 | Tragic 84.0% |
| Immigrants | Portugal | 1.2 /100 | #241 | Tragic 84.0% |
| Immigrants | Oceania | 1.1 /100 | #242 | Tragic 84.0% |
| Immigrants | Caribbean | 1.1 /100 | #243 | Tragic 84.0% |