Immigrants from Ethiopia vs Immigrants from Zimbabwe In Labor Force | Age 16-19
COMPARE
Immigrants from Ethiopia
Immigrants from Zimbabwe
In Labor Force | Age 16-19
In Labor Force | Age 16-19 Comparison
Immigrants from Ethiopia
Immigrants from Zimbabwe
38.6%
IN LABOR FORCE | AGE 16-19
98.7/ 100
METRIC RATING
108th/ 347
METRIC RANK
38.0%
IN LABOR FORCE | AGE 16-19
95.4/ 100
METRIC RATING
130th/ 347
METRIC RANK
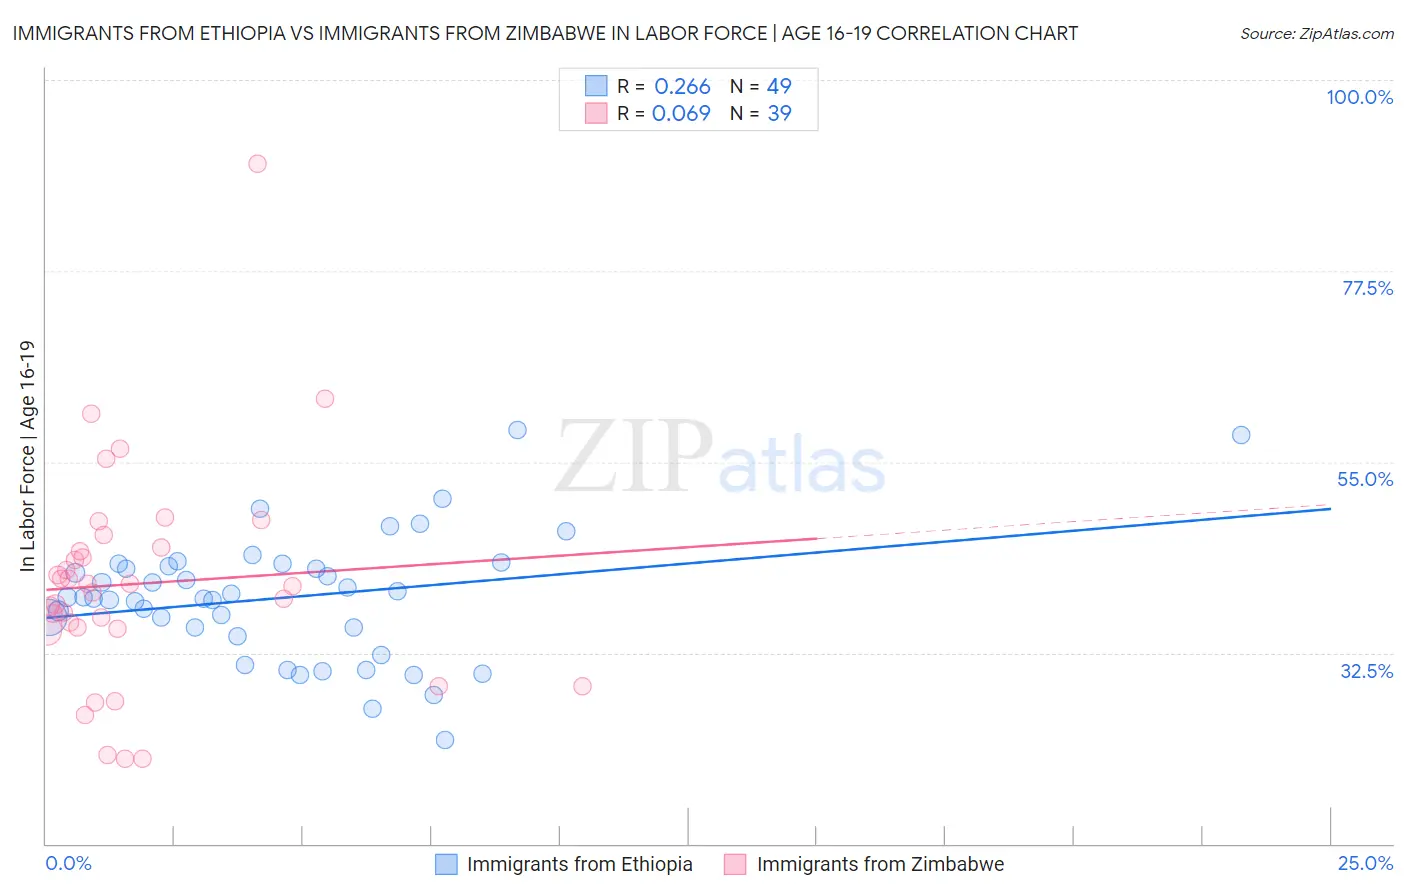
Immigrants from Ethiopia vs Immigrants from Zimbabwe In Labor Force | Age 16-19 Correlation Chart
The statistical analysis conducted on geographies consisting of 211,509,636 people shows a weak positive correlation between the proportion of Immigrants from Ethiopia and labor force participation rate among population between the ages 16 and 19 in the United States with a correlation coefficient (R) of 0.266 and weighted average of 38.6%. Similarly, the statistical analysis conducted on geographies consisting of 117,770,176 people shows a slight positive correlation between the proportion of Immigrants from Zimbabwe and labor force participation rate among population between the ages 16 and 19 in the United States with a correlation coefficient (R) of 0.069 and weighted average of 38.0%, a difference of 1.6%.
In Labor Force | Age 16-19 Correlation Summary
| Measurement | Immigrants from Ethiopia | Immigrants from Zimbabwe |
| Minimum | 22.2% | 20.0% |
| Maximum | 58.7% | 90.2% |
| Range | 36.5% | 70.2% |
| Mean | 39.0% | 40.6% |
| Median | 39.1% | 40.4% |
| Interquartile 25% (IQ1) | 35.0% | 35.3% |
| Interquartile 75% (IQ3) | 42.8% | 44.9% |
| Interquartile Range (IQR) | 7.9% | 9.6% |
| Standard Deviation (Sample) | 7.3% | 13.0% |
| Standard Deviation (Population) | 7.3% | 12.8% |
Similar Demographics by In Labor Force | Age 16-19
Demographics Similar to Immigrants from Ethiopia by In Labor Force | Age 16-19
In terms of in labor force | age 16-19, the demographic groups most similar to Immigrants from Ethiopia are Lebanese (38.6%, a difference of 0.0%), Chinese (38.6%, a difference of 0.10%), Maltese (38.5%, a difference of 0.12%), Delaware (38.6%, a difference of 0.13%), and Iraqi (38.6%, a difference of 0.15%).
| Demographics | Rating | Rank | In Labor Force | Age 16-19 |
| Hmong | 99.1 /100 | #101 | Exceptional 38.7% |
| Zimbabweans | 99.1 /100 | #102 | Exceptional 38.7% |
| Immigrants | Cameroon | 99.0 /100 | #103 | Exceptional 38.7% |
| Immigrants | Eritrea | 99.0 /100 | #104 | Exceptional 38.7% |
| Iraqis | 98.9 /100 | #105 | Exceptional 38.6% |
| Delaware | 98.8 /100 | #106 | Exceptional 38.6% |
| Chinese | 98.8 /100 | #107 | Exceptional 38.6% |
| Immigrants | Ethiopia | 98.7 /100 | #108 | Exceptional 38.6% |
| Lebanese | 98.7 /100 | #109 | Exceptional 38.6% |
| Maltese | 98.6 /100 | #110 | Exceptional 38.5% |
| Crow | 98.5 /100 | #111 | Exceptional 38.5% |
| Immigrants | Scotland | 98.5 /100 | #112 | Exceptional 38.5% |
| Sub-Saharan Africans | 98.3 /100 | #113 | Exceptional 38.4% |
| Hawaiians | 98.2 /100 | #114 | Exceptional 38.4% |
| Bulgarians | 97.9 /100 | #115 | Exceptional 38.3% |
Demographics Similar to Immigrants from Zimbabwe by In Labor Force | Age 16-19
In terms of in labor force | age 16-19, the demographic groups most similar to Immigrants from Zimbabwe are Spaniard (38.0%, a difference of 0.030%), New Zealander (38.0%, a difference of 0.050%), African (38.0%, a difference of 0.060%), Choctaw (38.0%, a difference of 0.060%), and Immigrants from Austria (37.9%, a difference of 0.090%).
| Demographics | Rating | Rank | In Labor Force | Age 16-19 |
| Seminole | 96.7 /100 | #123 | Exceptional 38.1% |
| Immigrants | England | 96.4 /100 | #124 | Exceptional 38.1% |
| Immigrants | Africa | 96.1 /100 | #125 | Exceptional 38.0% |
| Africans | 95.6 /100 | #126 | Exceptional 38.0% |
| Choctaw | 95.6 /100 | #127 | Exceptional 38.0% |
| New Zealanders | 95.6 /100 | #128 | Exceptional 38.0% |
| Spaniards | 95.5 /100 | #129 | Exceptional 38.0% |
| Immigrants | Zimbabwe | 95.4 /100 | #130 | Exceptional 38.0% |
| Immigrants | Austria | 95.0 /100 | #131 | Exceptional 37.9% |
| Immigrants | Oceania | 94.7 /100 | #132 | Exceptional 37.9% |
| Cheyenne | 94.6 /100 | #133 | Exceptional 37.9% |
| Immigrants | Netherlands | 93.7 /100 | #134 | Exceptional 37.8% |
| Macedonians | 93.4 /100 | #135 | Exceptional 37.8% |
| Australians | 93.2 /100 | #136 | Exceptional 37.8% |
| Cajuns | 93.2 /100 | #137 | Exceptional 37.8% |