Sierra Leonean vs Arapaho In Labor Force | Age > 16
COMPARE
Sierra Leonean
Arapaho
In Labor Force | Age > 16
In Labor Force | Age > 16 Comparison
Sierra Leoneans
Arapaho
68.9%
IN LABOR FORCE | AGE > 16
100.0/ 100
METRIC RATING
5th/ 347
METRIC RANK
62.1%
IN LABOR FORCE | AGE > 16
0.0/ 100
METRIC RATING
319th/ 347
METRIC RANK
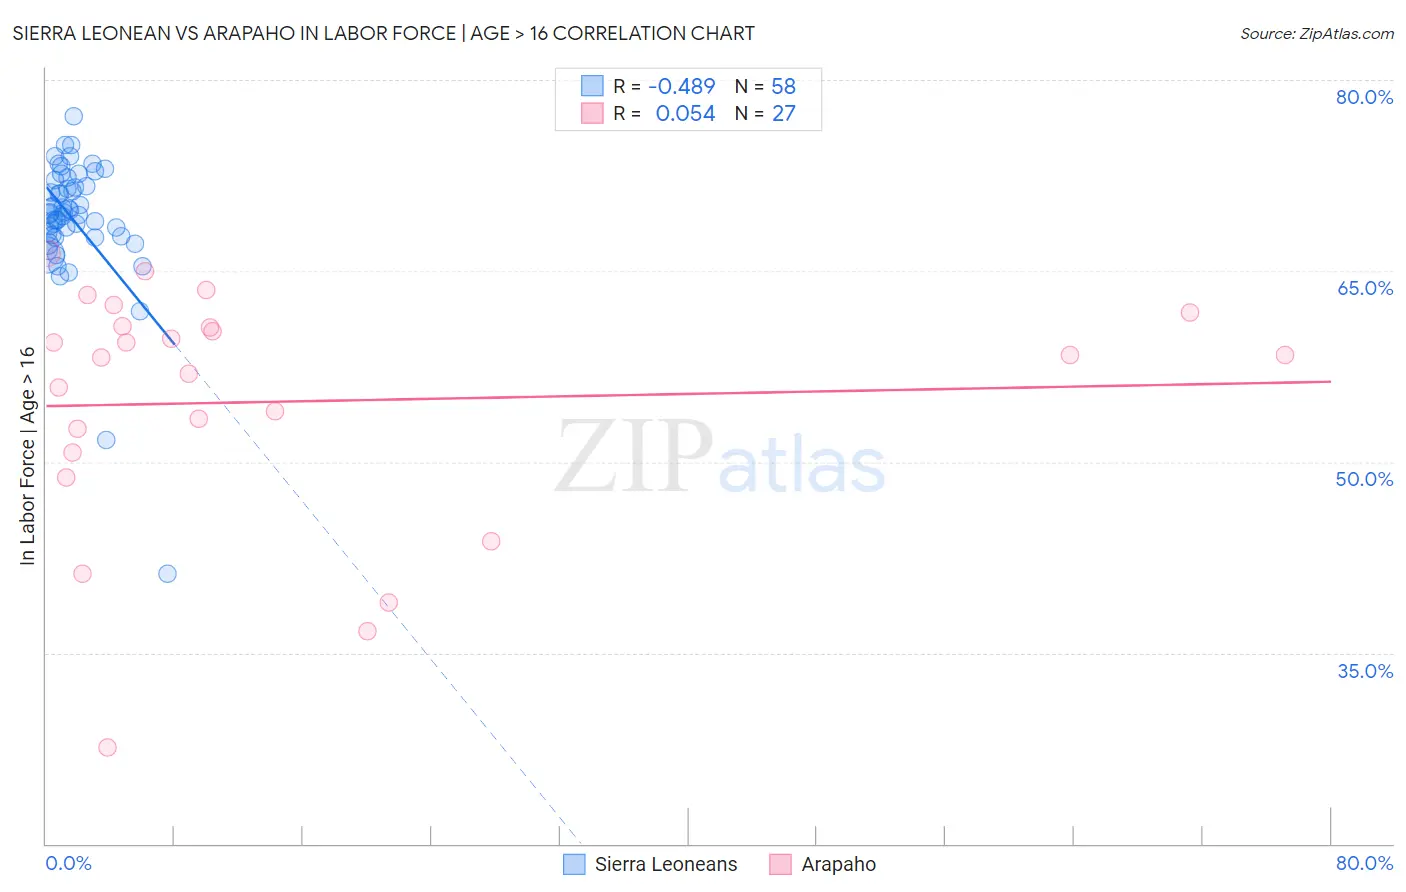
Sierra Leonean vs Arapaho In Labor Force | Age > 16 Correlation Chart
The statistical analysis conducted on geographies consisting of 83,361,112 people shows a moderate negative correlation between the proportion of Sierra Leoneans and labor force participation rate among population ages 16 and over in the United States with a correlation coefficient (R) of -0.489 and weighted average of 68.9%. Similarly, the statistical analysis conducted on geographies consisting of 29,780,325 people shows a slight positive correlation between the proportion of Arapaho and labor force participation rate among population ages 16 and over in the United States with a correlation coefficient (R) of 0.054 and weighted average of 62.1%, a difference of 10.9%.
In Labor Force | Age > 16 Correlation Summary
| Measurement | Sierra Leonean | Arapaho |
| Minimum | 41.2% | 27.6% |
| Maximum | 77.2% | 66.4% |
| Range | 36.0% | 38.8% |
| Mean | 69.0% | 54.7% |
| Median | 69.5% | 58.4% |
| Interquartile 25% (IQ1) | 67.7% | 50.7% |
| Interquartile 75% (IQ3) | 71.7% | 60.7% |
| Interquartile Range (IQR) | 4.0% | 10.0% |
| Standard Deviation (Sample) | 5.3% | 9.6% |
| Standard Deviation (Population) | 5.2% | 9.4% |
Similar Demographics by In Labor Force | Age > 16
Demographics Similar to Sierra Leoneans by In Labor Force | Age > 16
In terms of in labor force | age > 16, the demographic groups most similar to Sierra Leoneans are Immigrants from Eritrea (68.9%, a difference of 0.050%), Immigrants from Cameroon (68.7%, a difference of 0.30%), Immigrants from Somalia (69.1%, a difference of 0.31%), Somali (69.2%, a difference of 0.38%), and Ethiopian (69.3%, a difference of 0.58%).
| Demographics | Rating | Rank | In Labor Force | Age > 16 |
| Immigrants | Ethiopia | 100.0 /100 | #1 | Exceptional 69.4% |
| Ethiopians | 100.0 /100 | #2 | Exceptional 69.3% |
| Somalis | 100.0 /100 | #3 | Exceptional 69.2% |
| Immigrants | Somalia | 100.0 /100 | #4 | Exceptional 69.1% |
| Sierra Leoneans | 100.0 /100 | #5 | Exceptional 68.9% |
| Immigrants | Eritrea | 100.0 /100 | #6 | Exceptional 68.9% |
| Immigrants | Cameroon | 100.0 /100 | #7 | Exceptional 68.7% |
| Immigrants | Sierra Leone | 100.0 /100 | #8 | Exceptional 68.5% |
| Immigrants | Eastern Africa | 100.0 /100 | #9 | Exceptional 68.5% |
| Immigrants | Bolivia | 100.0 /100 | #10 | Exceptional 68.4% |
| Bolivians | 100.0 /100 | #11 | Exceptional 68.2% |
| Sudanese | 100.0 /100 | #12 | Exceptional 68.0% |
| Immigrants | Nepal | 100.0 /100 | #13 | Exceptional 68.0% |
| Liberians | 100.0 /100 | #14 | Exceptional 67.8% |
| Immigrants | Middle Africa | 100.0 /100 | #15 | Exceptional 67.7% |
Demographics Similar to Arapaho by In Labor Force | Age > 16
In terms of in labor force | age > 16, the demographic groups most similar to Arapaho are Yakama (62.1%, a difference of 0.0%), American (62.1%, a difference of 0.040%), Ottawa (62.0%, a difference of 0.20%), Seminole (62.0%, a difference of 0.22%), and Chickasaw (62.3%, a difference of 0.24%).
| Demographics | Rating | Rank | In Labor Force | Age > 16 |
| Iroquois | 0.0 /100 | #312 | Tragic 63.2% |
| Chippewa | 0.0 /100 | #313 | Tragic 63.1% |
| Yaqui | 0.0 /100 | #314 | Tragic 63.0% |
| Potawatomi | 0.0 /100 | #315 | Tragic 62.8% |
| Yup'ik | 0.0 /100 | #316 | Tragic 62.7% |
| Kiowa | 0.0 /100 | #317 | Tragic 62.4% |
| Chickasaw | 0.0 /100 | #318 | Tragic 62.3% |
| Arapaho | 0.0 /100 | #319 | Tragic 62.1% |
| Yakama | 0.0 /100 | #320 | Tragic 62.1% |
| Americans | 0.0 /100 | #321 | Tragic 62.1% |
| Ottawa | 0.0 /100 | #322 | Tragic 62.0% |
| Seminole | 0.0 /100 | #323 | Tragic 62.0% |
| Cheyenne | 0.0 /100 | #324 | Tragic 62.0% |
| Cherokee | 0.0 /100 | #325 | Tragic 61.9% |
| Sioux | 0.0 /100 | #326 | Tragic 61.8% |