Immigrants from Austria vs Arapaho In Labor Force | Age > 16
COMPARE
Immigrants from Austria
Arapaho
In Labor Force | Age > 16
In Labor Force | Age > 16 Comparison
Immigrants from Austria
Arapaho
63.9%
IN LABOR FORCE | AGE > 16
0.1/ 100
METRIC RATING
286th/ 347
METRIC RANK
62.1%
IN LABOR FORCE | AGE > 16
0.0/ 100
METRIC RATING
319th/ 347
METRIC RANK
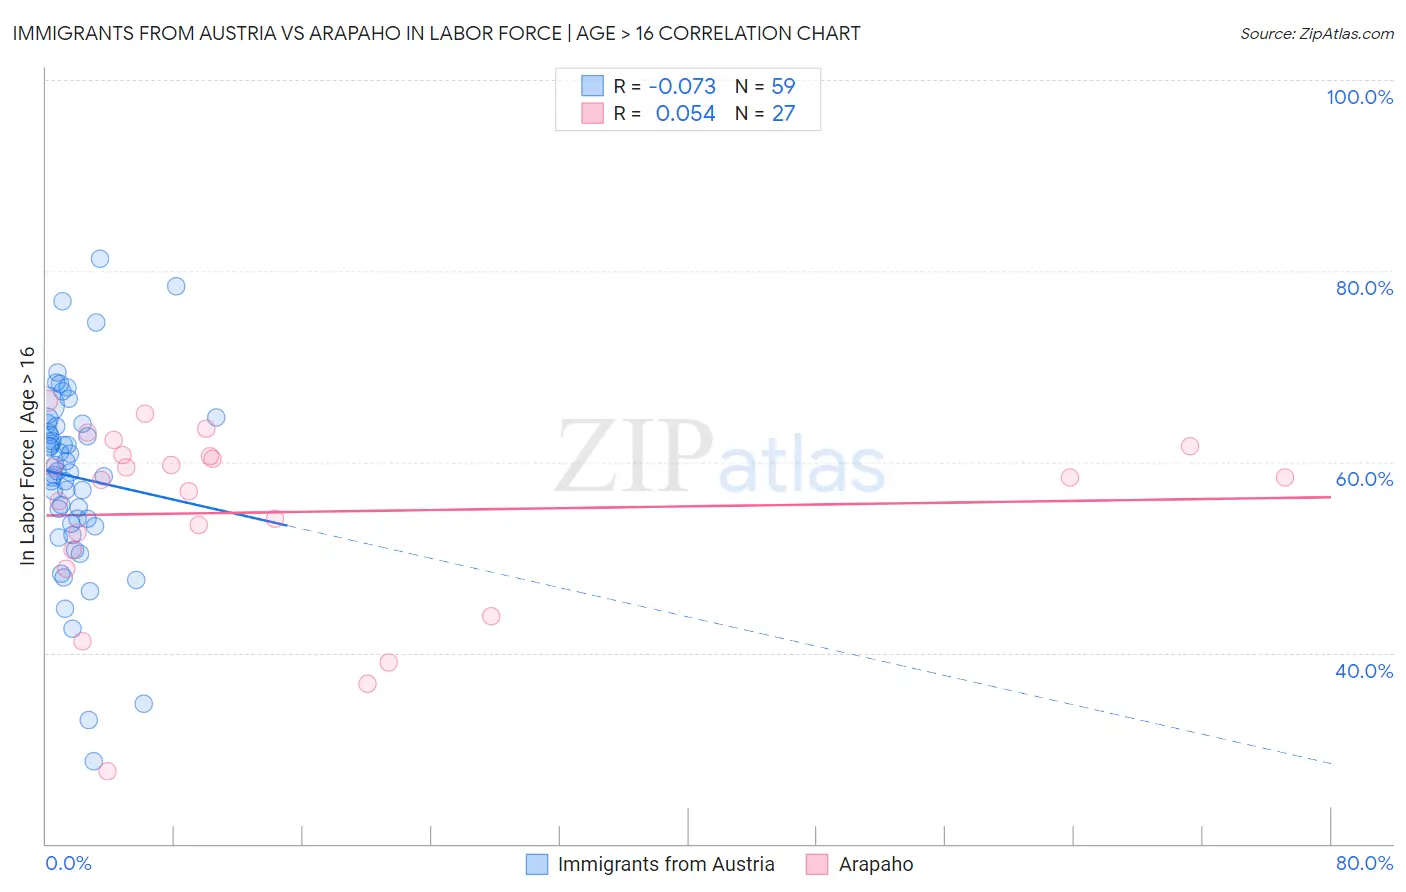
Immigrants from Austria vs Arapaho In Labor Force | Age > 16 Correlation Chart
The statistical analysis conducted on geographies consisting of 167,973,659 people shows a slight negative correlation between the proportion of Immigrants from Austria and labor force participation rate among population ages 16 and over in the United States with a correlation coefficient (R) of -0.073 and weighted average of 63.9%. Similarly, the statistical analysis conducted on geographies consisting of 29,780,325 people shows a slight positive correlation between the proportion of Arapaho and labor force participation rate among population ages 16 and over in the United States with a correlation coefficient (R) of 0.054 and weighted average of 62.1%, a difference of 2.8%.
In Labor Force | Age > 16 Correlation Summary
| Measurement | Immigrants from Austria | Arapaho |
| Minimum | 28.7% | 27.6% |
| Maximum | 81.3% | 66.4% |
| Range | 52.6% | 38.8% |
| Mean | 58.4% | 54.7% |
| Median | 59.0% | 58.4% |
| Interquartile 25% (IQ1) | 53.5% | 50.7% |
| Interquartile 75% (IQ3) | 64.0% | 60.7% |
| Interquartile Range (IQR) | 10.5% | 10.0% |
| Standard Deviation (Sample) | 10.0% | 9.6% |
| Standard Deviation (Population) | 9.9% | 9.4% |
Similar Demographics by In Labor Force | Age > 16
Demographics Similar to Immigrants from Austria by In Labor Force | Age > 16
In terms of in labor force | age > 16, the demographic groups most similar to Immigrants from Austria are Scottish (63.9%, a difference of 0.0%), Slovak (63.9%, a difference of 0.030%), Spanish (63.9%, a difference of 0.050%), French (63.9%, a difference of 0.060%), and Immigrants from Germany (63.9%, a difference of 0.070%).
| Demographics | Rating | Rank | In Labor Force | Age > 16 |
| Welsh | 0.2 /100 | #279 | Tragic 64.0% |
| Immigrants | St. Vincent and the Grenadines | 0.2 /100 | #280 | Tragic 64.0% |
| French Canadians | 0.2 /100 | #281 | Tragic 64.0% |
| Immigrants | Guyana | 0.2 /100 | #282 | Tragic 64.0% |
| Immigrants | Germany | 0.1 /100 | #283 | Tragic 63.9% |
| French | 0.1 /100 | #284 | Tragic 63.9% |
| Slovaks | 0.1 /100 | #285 | Tragic 63.9% |
| Immigrants | Austria | 0.1 /100 | #286 | Tragic 63.9% |
| Scottish | 0.1 /100 | #287 | Tragic 63.9% |
| Spanish | 0.1 /100 | #288 | Tragic 63.9% |
| Celtics | 0.1 /100 | #289 | Tragic 63.8% |
| Hungarians | 0.1 /100 | #290 | Tragic 63.8% |
| Nepalese | 0.1 /100 | #291 | Tragic 63.8% |
| Spanish American Indians | 0.1 /100 | #292 | Tragic 63.8% |
| English | 0.1 /100 | #293 | Tragic 63.7% |
Demographics Similar to Arapaho by In Labor Force | Age > 16
In terms of in labor force | age > 16, the demographic groups most similar to Arapaho are Yakama (62.1%, a difference of 0.0%), American (62.1%, a difference of 0.040%), Ottawa (62.0%, a difference of 0.20%), Seminole (62.0%, a difference of 0.22%), and Chickasaw (62.3%, a difference of 0.24%).
| Demographics | Rating | Rank | In Labor Force | Age > 16 |
| Iroquois | 0.0 /100 | #312 | Tragic 63.2% |
| Chippewa | 0.0 /100 | #313 | Tragic 63.1% |
| Yaqui | 0.0 /100 | #314 | Tragic 63.0% |
| Potawatomi | 0.0 /100 | #315 | Tragic 62.8% |
| Yup'ik | 0.0 /100 | #316 | Tragic 62.7% |
| Kiowa | 0.0 /100 | #317 | Tragic 62.4% |
| Chickasaw | 0.0 /100 | #318 | Tragic 62.3% |
| Arapaho | 0.0 /100 | #319 | Tragic 62.1% |
| Yakama | 0.0 /100 | #320 | Tragic 62.1% |
| Americans | 0.0 /100 | #321 | Tragic 62.1% |
| Ottawa | 0.0 /100 | #322 | Tragic 62.0% |
| Seminole | 0.0 /100 | #323 | Tragic 62.0% |
| Cheyenne | 0.0 /100 | #324 | Tragic 62.0% |
| Cherokee | 0.0 /100 | #325 | Tragic 61.9% |
| Sioux | 0.0 /100 | #326 | Tragic 61.8% |