Cheyenne vs Luxembourger In Labor Force | Age 25-29
COMPARE
Cheyenne
Luxembourger
In Labor Force | Age 25-29
In Labor Force | Age 25-29 Comparison
Cheyenne
Luxembourgers
80.3%
IN LABOR FORCE | AGE 25-29
0.0/ 100
METRIC RATING
331st/ 347
METRIC RANK
86.9%
IN LABOR FORCE | AGE 25-29
100.0/ 100
METRIC RATING
5th/ 347
METRIC RANK
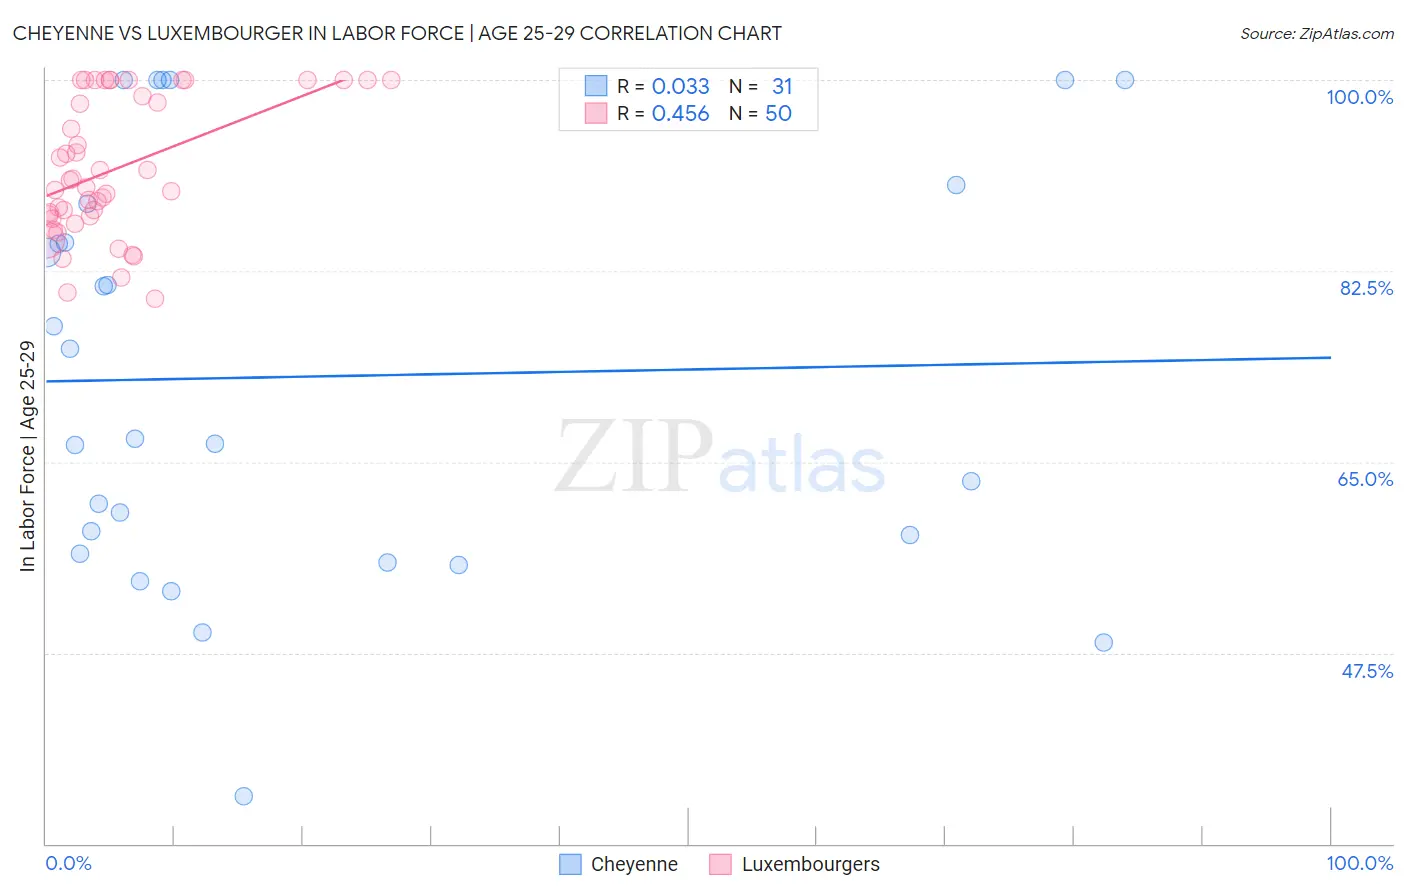
Cheyenne vs Luxembourger In Labor Force | Age 25-29 Correlation Chart
The statistical analysis conducted on geographies consisting of 80,678,314 people shows no correlation between the proportion of Cheyenne and labor force participation rate among population between the ages 25 and 29 in the United States with a correlation coefficient (R) of 0.033 and weighted average of 80.3%. Similarly, the statistical analysis conducted on geographies consisting of 144,653,840 people shows a moderate positive correlation between the proportion of Luxembourgers and labor force participation rate among population between the ages 25 and 29 in the United States with a correlation coefficient (R) of 0.456 and weighted average of 86.9%, a difference of 8.2%.
In Labor Force | Age 25-29 Correlation Summary
| Measurement | Cheyenne | Luxembourger |
| Minimum | 34.3% | 80.0% |
| Maximum | 100.0% | 100.0% |
| Range | 65.7% | 20.0% |
| Mean | 72.8% | 91.9% |
| Median | 67.1% | 90.5% |
| Interquartile 25% (IQ1) | 56.6% | 87.5% |
| Interquartile 75% (IQ3) | 88.6% | 100.0% |
| Interquartile Range (IQR) | 32.0% | 12.5% |
| Standard Deviation (Sample) | 18.9% | 6.2% |
| Standard Deviation (Population) | 18.6% | 6.2% |
Similar Demographics by In Labor Force | Age 25-29
Demographics Similar to Cheyenne by In Labor Force | Age 25-29
In terms of in labor force | age 25-29, the demographic groups most similar to Cheyenne are Puerto Rican (80.4%, a difference of 0.14%), Yakama (80.6%, a difference of 0.37%), Creek (80.7%, a difference of 0.48%), Ute (80.8%, a difference of 0.62%), and Inupiat (79.8%, a difference of 0.69%).
| Demographics | Rating | Rank | In Labor Force | Age 25-29 |
| Houma | 0.0 /100 | #324 | Tragic 81.2% |
| Dutch West Indians | 0.0 /100 | #325 | Tragic 81.1% |
| Choctaw | 0.0 /100 | #326 | Tragic 81.0% |
| Ute | 0.0 /100 | #327 | Tragic 80.8% |
| Creek | 0.0 /100 | #328 | Tragic 80.7% |
| Yakama | 0.0 /100 | #329 | Tragic 80.6% |
| Puerto Ricans | 0.0 /100 | #330 | Tragic 80.4% |
| Cheyenne | 0.0 /100 | #331 | Tragic 80.3% |
| Inupiat | 0.0 /100 | #332 | Tragic 79.8% |
| Sioux | 0.0 /100 | #333 | Tragic 79.7% |
| Yuman | 0.0 /100 | #334 | Tragic 79.3% |
| Natives/Alaskans | 0.0 /100 | #335 | Tragic 79.3% |
| Apache | 0.0 /100 | #336 | Tragic 79.2% |
| Crow | 0.0 /100 | #337 | Tragic 78.6% |
| Lumbee | 0.0 /100 | #338 | Tragic 78.3% |
Demographics Similar to Luxembourgers by In Labor Force | Age 25-29
In terms of in labor force | age 25-29, the demographic groups most similar to Luxembourgers are Carpatho Rusyn (87.0%, a difference of 0.10%), Immigrants from Somalia (87.1%, a difference of 0.19%), Somali (87.1%, a difference of 0.19%), Slovene (86.4%, a difference of 0.62%), and Immigrants from Bosnia and Herzegovina (86.3%, a difference of 0.74%).
| Demographics | Rating | Rank | In Labor Force | Age 25-29 |
| Tsimshian | 100.0 /100 | #1 | Exceptional 88.7% |
| Immigrants | Somalia | 100.0 /100 | #2 | Exceptional 87.1% |
| Somalis | 100.0 /100 | #3 | Exceptional 87.1% |
| Carpatho Rusyns | 100.0 /100 | #4 | Exceptional 87.0% |
| Luxembourgers | 100.0 /100 | #5 | Exceptional 86.9% |
| Slovenes | 100.0 /100 | #6 | Exceptional 86.4% |
| Immigrants | Bosnia and Herzegovina | 100.0 /100 | #7 | Exceptional 86.3% |
| Immigrants | Cabo Verde | 100.0 /100 | #8 | Exceptional 86.2% |
| Ethiopians | 100.0 /100 | #9 | Exceptional 86.2% |
| Liberians | 100.0 /100 | #10 | Exceptional 86.1% |
| Immigrants | Ethiopia | 100.0 /100 | #11 | Exceptional 86.1% |
| Immigrants | Lithuania | 100.0 /100 | #12 | Exceptional 86.1% |
| Norwegians | 100.0 /100 | #13 | Exceptional 86.1% |
| Latvians | 100.0 /100 | #14 | Exceptional 86.1% |
| Bolivians | 100.0 /100 | #15 | Exceptional 86.1% |