Guatemalan vs Immigrants from Lithuania In Labor Force | Age 16-19
COMPARE
Guatemalan
Immigrants from Lithuania
In Labor Force | Age 16-19
In Labor Force | Age 16-19 Comparison
Guatemalans
Immigrants from Lithuania
35.5%
IN LABOR FORCE | AGE 16-19
8.6/ 100
METRIC RATING
219th/ 347
METRIC RANK
37.2%
IN LABOR FORCE | AGE 16-19
80.7/ 100
METRIC RATING
155th/ 347
METRIC RANK
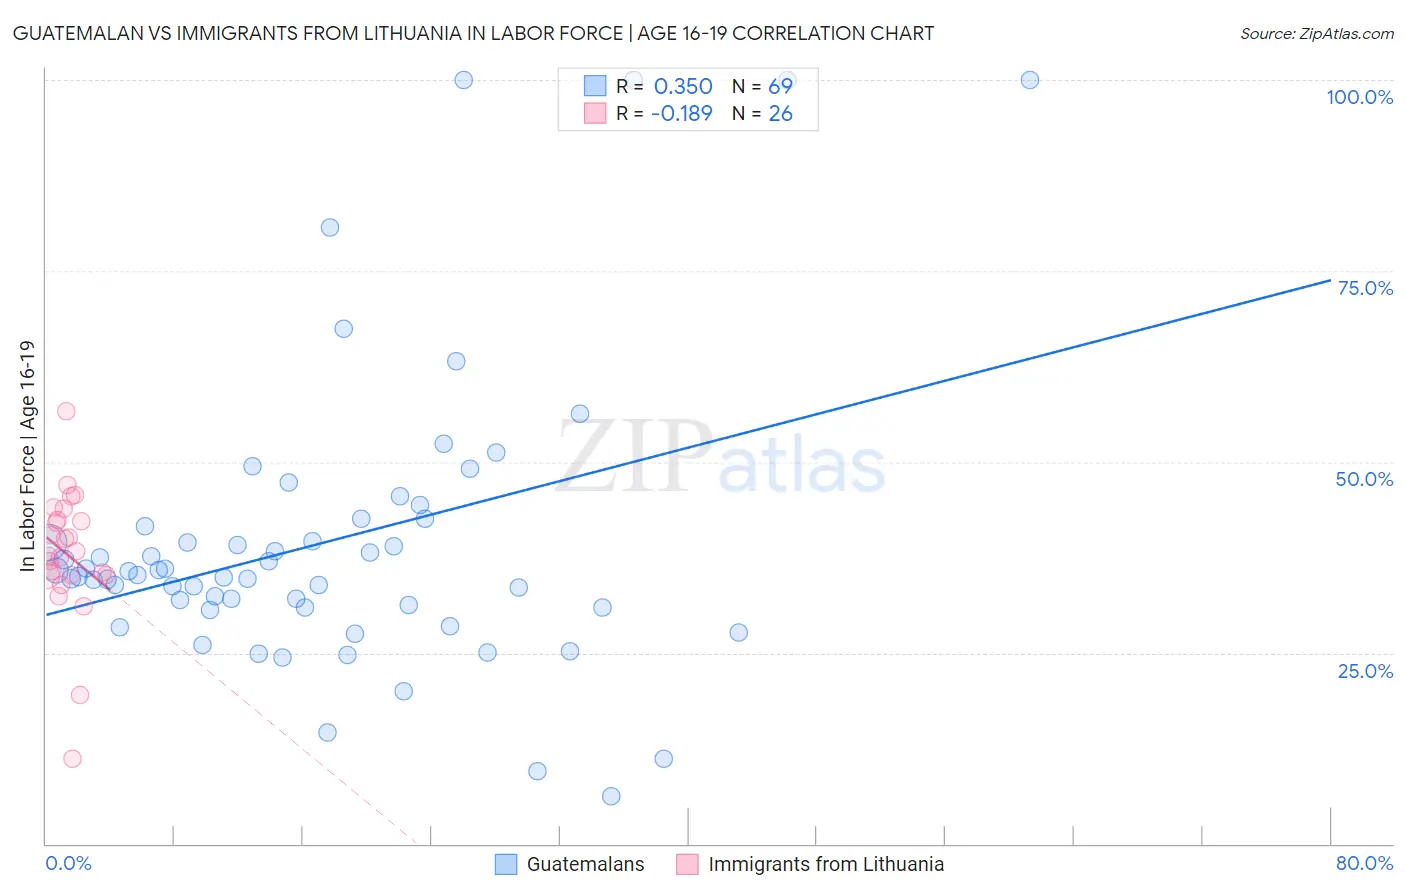
Guatemalan vs Immigrants from Lithuania In Labor Force | Age 16-19 Correlation Chart
The statistical analysis conducted on geographies consisting of 409,132,504 people shows a mild positive correlation between the proportion of Guatemalans and labor force participation rate among population between the ages 16 and 19 in the United States with a correlation coefficient (R) of 0.350 and weighted average of 35.5%. Similarly, the statistical analysis conducted on geographies consisting of 117,641,154 people shows a poor negative correlation between the proportion of Immigrants from Lithuania and labor force participation rate among population between the ages 16 and 19 in the United States with a correlation coefficient (R) of -0.189 and weighted average of 37.2%, a difference of 4.9%.
In Labor Force | Age 16-19 Correlation Summary
| Measurement | Guatemalan | Immigrants from Lithuania |
| Minimum | 6.3% | 11.2% |
| Maximum | 100.0% | 56.7% |
| Range | 93.7% | 45.5% |
| Mean | 39.5% | 37.9% |
| Median | 35.2% | 37.9% |
| Interquartile 25% (IQ1) | 30.9% | 35.1% |
| Interquartile 75% (IQ3) | 42.1% | 42.5% |
| Interquartile Range (IQR) | 11.2% | 7.3% |
| Standard Deviation (Sample) | 19.2% | 8.7% |
| Standard Deviation (Population) | 19.1% | 8.5% |
Similar Demographics by In Labor Force | Age 16-19
Demographics Similar to Guatemalans by In Labor Force | Age 16-19
In terms of in labor force | age 16-19, the demographic groups most similar to Guatemalans are Immigrants from Bahamas (35.5%, a difference of 0.060%), Sri Lankan (35.5%, a difference of 0.18%), Turkish (35.4%, a difference of 0.23%), Immigrants from Ghana (35.4%, a difference of 0.24%), and Dutch West Indian (35.6%, a difference of 0.30%).
| Demographics | Rating | Rank | In Labor Force | Age 16-19 |
| Houma | 11.0 /100 | #212 | Poor 35.6% |
| Immigrants | Bolivia | 11.0 /100 | #213 | Poor 35.6% |
| Apache | 11.0 /100 | #214 | Poor 35.6% |
| Immigrants | South Eastern Asia | 10.8 /100 | #215 | Poor 35.6% |
| Dutch West Indians | 10.7 /100 | #216 | Poor 35.6% |
| Immigrants | Costa Rica | 10.7 /100 | #217 | Poor 35.6% |
| Sri Lankans | 9.8 /100 | #218 | Tragic 35.5% |
| Guatemalans | 8.6 /100 | #219 | Tragic 35.5% |
| Immigrants | Bahamas | 8.3 /100 | #220 | Tragic 35.5% |
| Turks | 7.3 /100 | #221 | Tragic 35.4% |
| Immigrants | Ghana | 7.3 /100 | #222 | Tragic 35.4% |
| Ghanaians | 6.5 /100 | #223 | Tragic 35.3% |
| Hondurans | 6.5 /100 | #224 | Tragic 35.3% |
| Immigrants | Belgium | 6.1 /100 | #225 | Tragic 35.3% |
| Immigrants | Guatemala | 5.7 /100 | #226 | Tragic 35.3% |
Demographics Similar to Immigrants from Lithuania by In Labor Force | Age 16-19
In terms of in labor force | age 16-19, the demographic groups most similar to Immigrants from Lithuania are Kiowa (37.2%, a difference of 0.020%), Immigrants from Bulgaria (37.3%, a difference of 0.070%), Arapaho (37.3%, a difference of 0.090%), Immigrants from Sierra Leone (37.3%, a difference of 0.25%), and Immigrants from Brazil (37.1%, a difference of 0.31%).
| Demographics | Rating | Rank | In Labor Force | Age 16-19 |
| Romanians | 87.3 /100 | #148 | Excellent 37.5% |
| Native Hawaiians | 85.0 /100 | #149 | Excellent 37.4% |
| Tsimshian | 84.7 /100 | #150 | Excellent 37.4% |
| Immigrants | Poland | 84.4 /100 | #151 | Excellent 37.3% |
| Immigrants | Sierra Leone | 83.6 /100 | #152 | Excellent 37.3% |
| Arapaho | 81.8 /100 | #153 | Excellent 37.3% |
| Immigrants | Bulgaria | 81.6 /100 | #154 | Excellent 37.3% |
| Immigrants | Lithuania | 80.7 /100 | #155 | Excellent 37.2% |
| Kiowa | 80.4 /100 | #156 | Excellent 37.2% |
| Immigrants | Brazil | 76.5 /100 | #157 | Good 37.1% |
| Ute | 75.7 /100 | #158 | Good 37.1% |
| Yaqui | 74.4 /100 | #159 | Good 37.1% |
| Immigrants | Saudi Arabia | 73.9 /100 | #160 | Good 37.0% |
| Cambodians | 71.5 /100 | #161 | Good 37.0% |
| Immigrants | Jordan | 69.5 /100 | #162 | Good 36.9% |