Serbian vs Immigrants from Nigeria In Labor Force | Age 30-34
COMPARE
Serbian
Immigrants from Nigeria
In Labor Force | Age 30-34
In Labor Force | Age 30-34 Comparison
Serbians
Immigrants from Nigeria
85.8%
IN LABOR FORCE | AGE 30-34
99.9/ 100
METRIC RATING
35th/ 347
METRIC RANK
84.6%
IN LABOR FORCE | AGE 30-34
42.5/ 100
METRIC RATING
179th/ 347
METRIC RANK
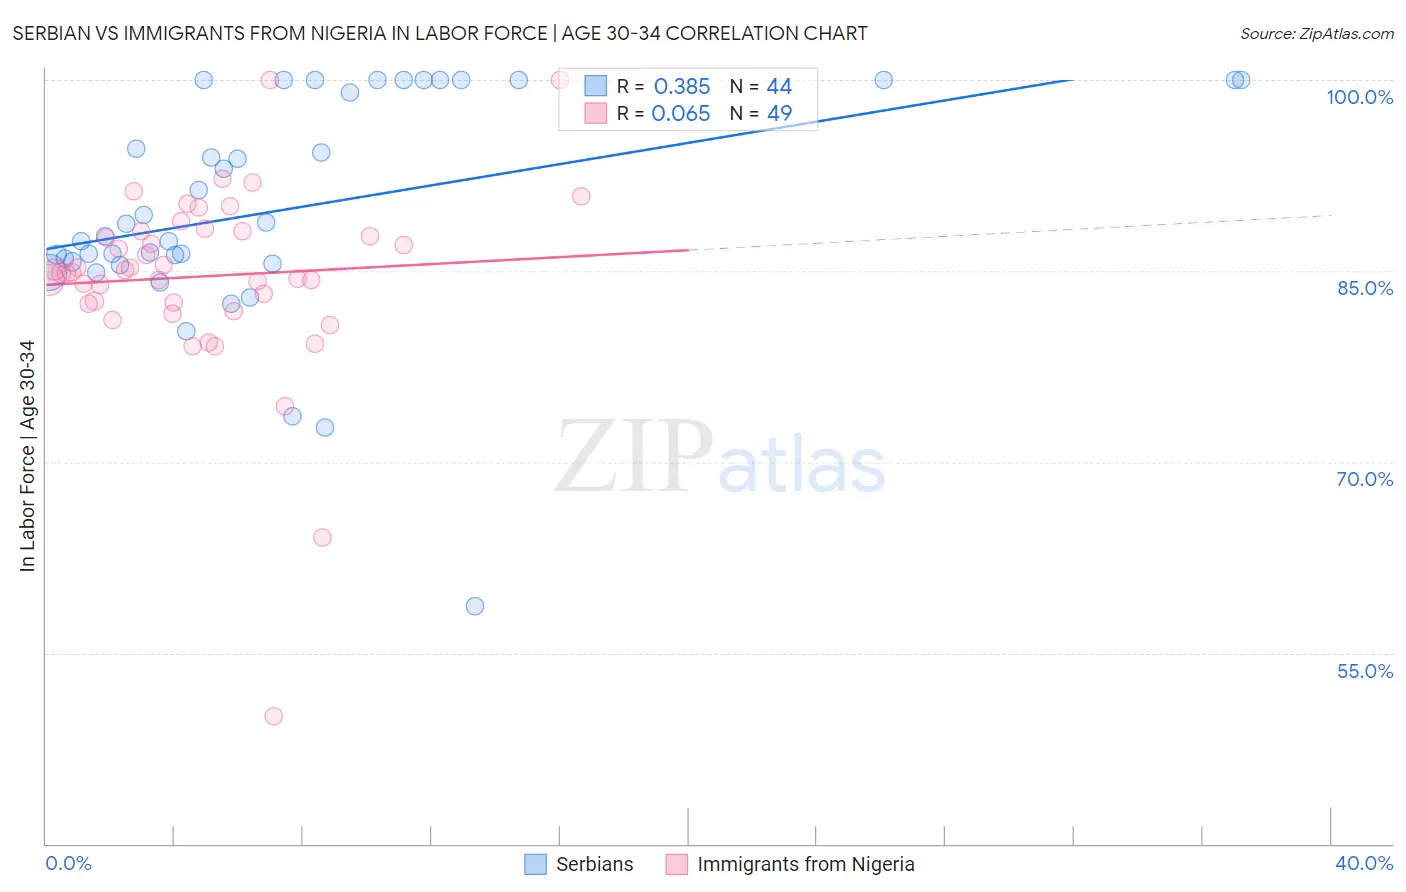
Serbian vs Immigrants from Nigeria In Labor Force | Age 30-34 Correlation Chart
The statistical analysis conducted on geographies consisting of 267,513,994 people shows a mild positive correlation between the proportion of Serbians and labor force participation rate among population between the ages 30 and 34 in the United States with a correlation coefficient (R) of 0.385 and weighted average of 85.8%. Similarly, the statistical analysis conducted on geographies consisting of 283,347,406 people shows a slight positive correlation between the proportion of Immigrants from Nigeria and labor force participation rate among population between the ages 30 and 34 in the United States with a correlation coefficient (R) of 0.065 and weighted average of 84.6%, a difference of 1.3%.
In Labor Force | Age 30-34 Correlation Summary
| Measurement | Serbian | Immigrants from Nigeria |
| Minimum | 58.7% | 50.0% |
| Maximum | 100.0% | 100.0% |
| Range | 41.3% | 50.0% |
| Mean | 89.9% | 84.6% |
| Median | 88.2% | 84.9% |
| Interquartile 25% (IQ1) | 85.6% | 82.5% |
| Interquartile 75% (IQ3) | 100.0% | 88.1% |
| Interquartile Range (IQR) | 14.4% | 5.6% |
| Standard Deviation (Sample) | 8.9% | 7.6% |
| Standard Deviation (Population) | 8.8% | 7.5% |
Similar Demographics by In Labor Force | Age 30-34
Demographics Similar to Serbians by In Labor Force | Age 30-34
In terms of in labor force | age 30-34, the demographic groups most similar to Serbians are Ugandan (85.8%, a difference of 0.0%), Albanian (85.7%, a difference of 0.0%), Immigrants from Bosnia and Herzegovina (85.8%, a difference of 0.010%), Norwegian (85.7%, a difference of 0.010%), and Immigrants from Greece (85.7%, a difference of 0.020%).
| Demographics | Rating | Rank | In Labor Force | Age 30-34 |
| Immigrants | Latvia | 100.0 /100 | #28 | Exceptional 85.9% |
| Tsimshian | 100.0 /100 | #29 | Exceptional 85.8% |
| Immigrants | Hong Kong | 100.0 /100 | #30 | Exceptional 85.8% |
| Paraguayans | 99.9 /100 | #31 | Exceptional 85.8% |
| Cypriots | 99.9 /100 | #32 | Exceptional 85.8% |
| Immigrants | Bosnia and Herzegovina | 99.9 /100 | #33 | Exceptional 85.8% |
| Ugandans | 99.9 /100 | #34 | Exceptional 85.8% |
| Serbians | 99.9 /100 | #35 | Exceptional 85.8% |
| Albanians | 99.9 /100 | #36 | Exceptional 85.7% |
| Norwegians | 99.9 /100 | #37 | Exceptional 85.7% |
| Immigrants | Greece | 99.9 /100 | #38 | Exceptional 85.7% |
| Eastern Europeans | 99.9 /100 | #39 | Exceptional 85.7% |
| Turks | 99.9 /100 | #40 | Exceptional 85.7% |
| Immigrants | Italy | 99.9 /100 | #41 | Exceptional 85.7% |
| Zimbabweans | 99.8 /100 | #42 | Exceptional 85.6% |
Demographics Similar to Immigrants from Nigeria by In Labor Force | Age 30-34
In terms of in labor force | age 30-34, the demographic groups most similar to Immigrants from Nigeria are Immigrants from Netherlands (84.6%, a difference of 0.0%), Okinawan (84.6%, a difference of 0.010%), Moroccan (84.6%, a difference of 0.020%), Laotian (84.7%, a difference of 0.030%), and Barbadian (84.6%, a difference of 0.040%).
| Demographics | Rating | Rank | In Labor Force | Age 30-34 |
| Immigrants | England | 51.7 /100 | #172 | Average 84.7% |
| Israelis | 51.1 /100 | #173 | Average 84.7% |
| Finns | 50.0 /100 | #174 | Average 84.7% |
| Immigrants | South America | 50.0 /100 | #175 | Average 84.7% |
| Immigrants | Uzbekistan | 49.1 /100 | #176 | Average 84.7% |
| Laotians | 46.9 /100 | #177 | Average 84.7% |
| Okinawans | 44.1 /100 | #178 | Average 84.6% |
| Immigrants | Nigeria | 42.5 /100 | #179 | Average 84.6% |
| Immigrants | Netherlands | 42.1 /100 | #180 | Average 84.6% |
| Moroccans | 40.3 /100 | #181 | Average 84.6% |
| Barbadians | 36.7 /100 | #182 | Fair 84.6% |
| Immigrants | Canada | 35.0 /100 | #183 | Fair 84.6% |
| Immigrants | North America | 33.3 /100 | #184 | Fair 84.6% |
| Immigrants | Philippines | 31.5 /100 | #185 | Fair 84.6% |
| Immigrants | Congo | 29.7 /100 | #186 | Fair 84.6% |