Serbian vs Portuguese Unemployment Among Ages 25 to 29 years
COMPARE
Serbian
Portuguese
Unemployment Among Ages 25 to 29 years
Unemployment Among Ages 25 to 29 years Comparison
Serbians
Portuguese
6.4%
UNEMPLOYMENT AMONG AGES 25 TO 29 YEARS
91.7/ 100
METRIC RATING
98th/ 347
METRIC RANK
7.2%
UNEMPLOYMENT AMONG AGES 25 TO 29 YEARS
0.5/ 100
METRIC RATING
251st/ 347
METRIC RANK
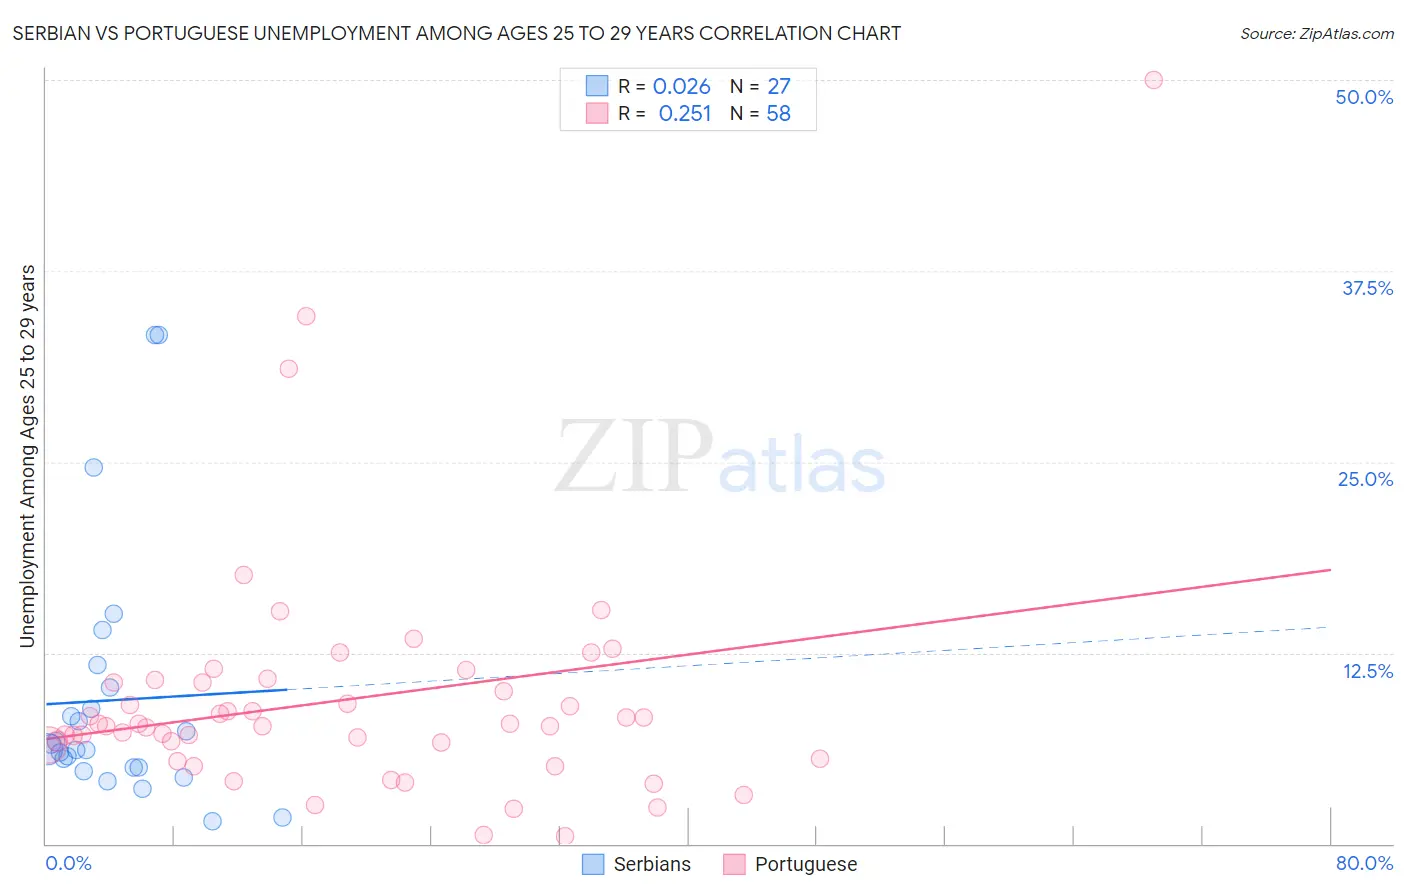
Serbian vs Portuguese Unemployment Among Ages 25 to 29 years Correlation Chart
The statistical analysis conducted on geographies consisting of 256,984,110 people shows no correlation between the proportion of Serbians and unemployment rate among population between the ages 25 and 29 in the United States with a correlation coefficient (R) of 0.026 and weighted average of 6.4%. Similarly, the statistical analysis conducted on geographies consisting of 421,376,294 people shows a weak positive correlation between the proportion of Portuguese and unemployment rate among population between the ages 25 and 29 in the United States with a correlation coefficient (R) of 0.251 and weighted average of 7.2%, a difference of 12.3%.
Unemployment Among Ages 25 to 29 years Correlation Summary
| Measurement | Serbian | Portuguese |
| Minimum | 1.5% | 0.50% |
| Maximum | 33.3% | 50.0% |
| Range | 31.8% | 49.5% |
| Mean | 9.4% | 9.5% |
| Median | 6.2% | 7.8% |
| Interquartile 25% (IQ1) | 5.0% | 6.5% |
| Interquartile 75% (IQ3) | 10.3% | 10.6% |
| Interquartile Range (IQR) | 5.3% | 4.1% |
| Standard Deviation (Sample) | 8.3% | 7.9% |
| Standard Deviation (Population) | 8.2% | 7.8% |
Similar Demographics by Unemployment Among Ages 25 to 29 years
Demographics Similar to Serbians by Unemployment Among Ages 25 to 29 years
In terms of unemployment among ages 25 to 29 years, the demographic groups most similar to Serbians are Immigrants from Eastern Europe (6.4%, a difference of 0.030%), Immigrants from Brazil (6.4%, a difference of 0.090%), Iraqi (6.4%, a difference of 0.090%), Uruguayan (6.4%, a difference of 0.11%), and Immigrants from Ireland (6.4%, a difference of 0.13%).
| Demographics | Rating | Rank | Unemployment Among Ages 25 to 29 years |
| Egyptians | 93.9 /100 | #91 | Exceptional 6.4% |
| Immigrants | North Macedonia | 93.6 /100 | #92 | Exceptional 6.4% |
| Australians | 93.6 /100 | #93 | Exceptional 6.4% |
| Zimbabweans | 93.5 /100 | #94 | Exceptional 6.4% |
| Afghans | 92.5 /100 | #95 | Exceptional 6.4% |
| Immigrants | Brazil | 92.1 /100 | #96 | Exceptional 6.4% |
| Immigrants | Eastern Europe | 91.9 /100 | #97 | Exceptional 6.4% |
| Serbians | 91.7 /100 | #98 | Exceptional 6.4% |
| Iraqis | 91.3 /100 | #99 | Exceptional 6.4% |
| Uruguayans | 91.2 /100 | #100 | Exceptional 6.4% |
| Immigrants | Ireland | 91.1 /100 | #101 | Exceptional 6.4% |
| British | 90.5 /100 | #102 | Exceptional 6.4% |
| Immigrants | Congo | 90.4 /100 | #103 | Exceptional 6.4% |
| Cypriots | 90.1 /100 | #104 | Exceptional 6.4% |
| Immigrants | Kazakhstan | 89.8 /100 | #105 | Excellent 6.4% |
Demographics Similar to Portuguese by Unemployment Among Ages 25 to 29 years
In terms of unemployment among ages 25 to 29 years, the demographic groups most similar to Portuguese are Delaware (7.2%, a difference of 0.060%), Seminole (7.2%, a difference of 0.22%), Subsaharan African (7.2%, a difference of 0.25%), Sierra Leonean (7.2%, a difference of 0.26%), and Immigrants from Guatemala (7.2%, a difference of 0.41%).
| Demographics | Rating | Rank | Unemployment Among Ages 25 to 29 years |
| Immigrants | Nonimmigrants | 0.9 /100 | #244 | Tragic 7.1% |
| Guatemalans | 0.9 /100 | #245 | Tragic 7.1% |
| Immigrants | Uzbekistan | 0.7 /100 | #246 | Tragic 7.2% |
| Immigrants | Guatemala | 0.7 /100 | #247 | Tragic 7.2% |
| Sub-Saharan Africans | 0.6 /100 | #248 | Tragic 7.2% |
| Seminole | 0.6 /100 | #249 | Tragic 7.2% |
| Delaware | 0.5 /100 | #250 | Tragic 7.2% |
| Portuguese | 0.5 /100 | #251 | Tragic 7.2% |
| Sierra Leoneans | 0.4 /100 | #252 | Tragic 7.2% |
| Immigrants | Portugal | 0.3 /100 | #253 | Tragic 7.2% |
| Ghanaians | 0.3 /100 | #254 | Tragic 7.2% |
| Immigrants | Cameroon | 0.3 /100 | #255 | Tragic 7.2% |
| Mexican American Indians | 0.3 /100 | #256 | Tragic 7.3% |
| Assyrians/Chaldeans/Syriacs | 0.2 /100 | #257 | Tragic 7.3% |
| Ottawa | 0.1 /100 | #258 | Tragic 7.3% |