Laotian vs Immigrants from Kuwait In Labor Force | Age 45-54
COMPARE
Laotian
Immigrants from Kuwait
In Labor Force | Age 45-54
In Labor Force | Age 45-54 Comparison
Laotians
Immigrants from Kuwait
82.9%
IN LABOR FORCE | AGE 45-54
62.8/ 100
METRIC RATING
160th/ 347
METRIC RANK
83.3%
IN LABOR FORCE | AGE 45-54
94.8/ 100
METRIC RATING
96th/ 347
METRIC RANK
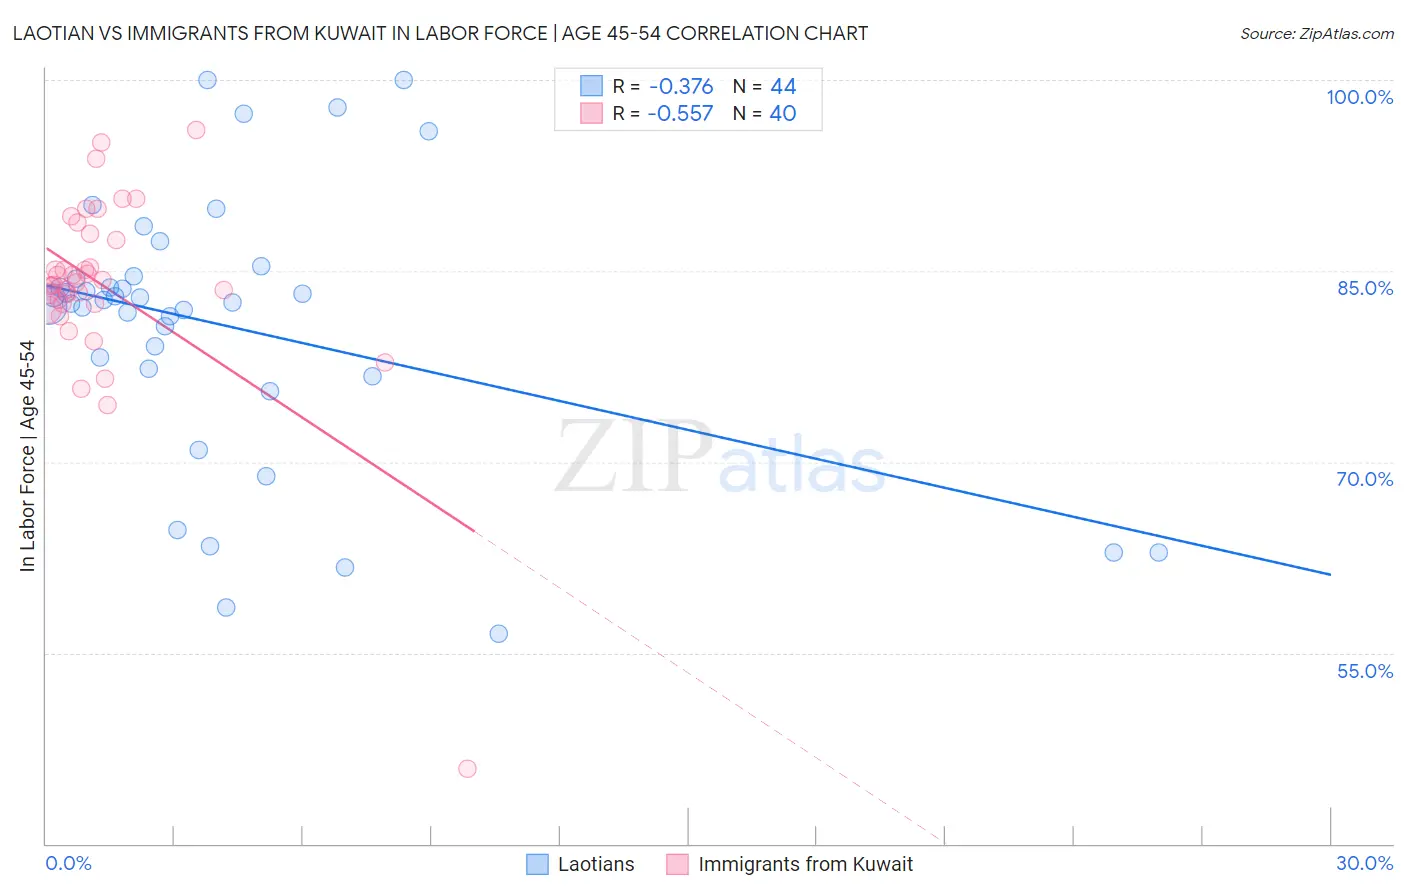
Laotian vs Immigrants from Kuwait In Labor Force | Age 45-54 Correlation Chart
The statistical analysis conducted on geographies consisting of 224,742,074 people shows a mild negative correlation between the proportion of Laotians and labor force participation rate among population between the ages 45 and 54 in the United States with a correlation coefficient (R) of -0.376 and weighted average of 82.9%. Similarly, the statistical analysis conducted on geographies consisting of 136,878,759 people shows a substantial negative correlation between the proportion of Immigrants from Kuwait and labor force participation rate among population between the ages 45 and 54 in the United States with a correlation coefficient (R) of -0.557 and weighted average of 83.3%, a difference of 0.52%.
In Labor Force | Age 45-54 Correlation Summary
| Measurement | Laotian | Immigrants from Kuwait |
| Minimum | 56.5% | 45.9% |
| Maximum | 100.0% | 96.1% |
| Range | 43.5% | 50.2% |
| Mean | 80.6% | 83.8% |
| Median | 82.6% | 84.0% |
| Interquartile 25% (IQ1) | 77.0% | 82.4% |
| Interquartile 75% (IQ3) | 84.5% | 87.7% |
| Interquartile Range (IQR) | 7.5% | 5.3% |
| Standard Deviation (Sample) | 10.7% | 7.8% |
| Standard Deviation (Population) | 10.5% | 7.7% |
Similar Demographics by In Labor Force | Age 45-54
Demographics Similar to Laotians by In Labor Force | Age 45-54
In terms of in labor force | age 45-54, the demographic groups most similar to Laotians are South American Indian (82.9%, a difference of 0.010%), Haitian (82.8%, a difference of 0.010%), Dutch (82.8%, a difference of 0.010%), German Russian (82.8%, a difference of 0.010%), and Immigrants from Austria (82.9%, a difference of 0.020%).
| Demographics | Rating | Rank | In Labor Force | Age 45-54 |
| Immigrants | Indonesia | 70.6 /100 | #153 | Good 82.9% |
| Immigrants | Ghana | 70.3 /100 | #154 | Good 82.9% |
| Immigrants | Philippines | 69.0 /100 | #155 | Good 82.9% |
| Immigrants | Saudi Arabia | 68.8 /100 | #156 | Good 82.9% |
| Immigrants | Australia | 68.2 /100 | #157 | Good 82.9% |
| Immigrants | Southern Europe | 67.8 /100 | #158 | Good 82.9% |
| Immigrants | Austria | 64.6 /100 | #159 | Good 82.9% |
| Laotians | 62.8 /100 | #160 | Good 82.9% |
| South American Indians | 62.2 /100 | #161 | Good 82.9% |
| Haitians | 61.8 /100 | #162 | Good 82.8% |
| Dutch | 61.7 /100 | #163 | Good 82.8% |
| German Russians | 61.3 /100 | #164 | Good 82.8% |
| Immigrants | Sudan | 59.9 /100 | #165 | Average 82.8% |
| Immigrants | South Eastern Asia | 57.4 /100 | #166 | Average 82.8% |
| Swiss | 56.5 /100 | #167 | Average 82.8% |
Demographics Similar to Immigrants from Kuwait by In Labor Force | Age 45-54
In terms of in labor force | age 45-54, the demographic groups most similar to Immigrants from Kuwait are Immigrants from Argentina (83.3%, a difference of 0.0%), Palestinian (83.3%, a difference of 0.0%), Argentinean (83.3%, a difference of 0.010%), Danish (83.3%, a difference of 0.020%), and Italian (83.3%, a difference of 0.020%).
| Demographics | Rating | Rank | In Labor Force | Age 45-54 |
| Indians (Asian) | 95.5 /100 | #89 | Exceptional 83.3% |
| Immigrants | Japan | 95.5 /100 | #90 | Exceptional 83.3% |
| South Americans | 95.5 /100 | #91 | Exceptional 83.3% |
| Danes | 95.3 /100 | #92 | Exceptional 83.3% |
| Italians | 95.1 /100 | #93 | Exceptional 83.3% |
| Argentineans | 94.9 /100 | #94 | Exceptional 83.3% |
| Immigrants | Argentina | 94.9 /100 | #95 | Exceptional 83.3% |
| Immigrants | Kuwait | 94.8 /100 | #96 | Exceptional 83.3% |
| Palestinians | 94.8 /100 | #97 | Exceptional 83.3% |
| Maltese | 94.4 /100 | #98 | Exceptional 83.3% |
| Immigrants | Middle Africa | 94.3 /100 | #99 | Exceptional 83.3% |
| Mongolians | 94.2 /100 | #100 | Exceptional 83.3% |
| Immigrants | Belarus | 94.1 /100 | #101 | Exceptional 83.3% |
| Immigrants | Singapore | 93.9 /100 | #102 | Exceptional 83.3% |
| Albanians | 93.9 /100 | #103 | Exceptional 83.3% |