Serbian vs Czech Child Poverty Under the Age of 5

COMPARE

Serbian
Race
Ancestry
AfghanAfricanAlaska NativeAlaskan AthabascanAlbanianAleutAlsatianAmericanApacheArabArapahoArgentineanArmenianAssyrian/Chaldean/SyriacAustralianAustrianBahamianBangladeshiBarbadianBasqueBelgianBelizeanBermudanBhutaneseBlackfeetBolivianBrazilianBritishBritish West IndianBulgarianBurmeseCajunCambodianCanadianCape VerdeanCarpatho RusynCelticCentral AmericanCentral American IndianCherokeeCheyenneChickasawChileanChineseChippewaChoctawColombianColvilleComancheCosta RicanCreeCreekCroatianCrowCubanCypriotCzechoslovakianDanishDelawareDominicanDutchDutch West IndianEastern EuropeanEcuadorianEgyptianEnglishEstonianEthiopianEuropeanFijianFilipinoFinnishFrenchFrench American IndianFrench CanadianGermanGerman RussianGhanaianGreekGuamanian/ChamorroGuatemalanGuyaneseHaitianHmongHonduranHopiHoumaHungarianIcelanderIndian (Asian)IndonesianInupiatIranianIraqiIrishIroquoisIsraeliItalianJamaicanJapaneseJordanianKenyanKiowaKoreanLaotianLatvianLebaneseLiberianLithuanianLumbeeLuxembourgerMacedonianMalaysianMalteseMarshalleseMenomineeMexicanMexican American IndianMongolianMoroccanNative HawaiianNavajoNepaleseNew ZealanderNicaraguanNigerianNorthern EuropeanNorwegianOkinawanOsageOttawaPaiutePakistaniPalestinianPanamanianParaguayanPennsylvania GermanPeruvianPimaPolishPortuguesePotawatomiPuebloPuerto RicanPuget Sound SalishRomanianRussianSalvadoranSamoanScandinavianScotch-IrishScottishSeminoleSenegaleseSerbianShoshoneSierra LeoneanSiouxSlavicSlovakSloveneSomaliSouth AfricanSouth AmericanSouth American IndianSoviet UnionSpaniardSpanishSpanish AmericanSpanish American IndianSri LankanSubsaharan AfricanSudaneseSwedishSwissSyrianTaiwaneseThaiTlingit-HaidaTohono O'OdhamTonganTrinidadian and TobagonianTsimshianTurkishU.S. Virgin IslanderUgandanUkrainianUruguayanUteVenezuelanVietnameseWelshWest IndianYakamaYaquiYugoslavianYumanYup'ikZimbabwean
Immigration
NonimmigrantsImmigrantsAfghanistanAfricaAlbaniaArgentinaArmeniaAsiaAustraliaAustriaBahamasBangladeshBarbadosBelarusBelgiumBelizeBoliviaBosnia and HerzegovinaBrazilBulgariaBurma/MyanmarCabo VerdeCambodiaCameroonCanadaCaribbeanCentral AmericaChileChinaColombiaCongoCosta RicaCroatiaCubaCzechoslovakiaDenmarkDominicaDominican RepublicEastern AfricaEastern AsiaEastern EuropeEcuadorEgyptEl SalvadorEnglandEritreaEthiopiaEuropeFijiFranceGermanyGhanaGreeceGrenadaGuatemalaGuyanaHaitiHondurasHong KongHungaryIndiaIndonesiaIranIraqIrelandIsraelItalyJamaicaJapanJordanKazakhstanKenyaKoreaKuwaitLaosLatin AmericaLatviaLebanonLiberiaLithuaniaMalaysiaMexicoMicronesiaMiddle AfricaMoldovaMoroccoNepalNetherlandsNicaraguaNigeriaNorth AmericaNorth MacedoniaNorthern AfricaNorthern EuropeNorwayOceaniaPakistanPanamaPeruPhilippinesPolandPortugalRomaniaRussiaSaudi ArabiaScotlandSenegalSerbiaSierra LeoneSingaporeSomaliaSouth AfricaSouth AmericaSouth Central AsiaSouth Eastern AsiaSouthern EuropeSpainSri LankaSt. Vincent and the GrenadinesSudanSwedenSwitzerlandSyriaTaiwanThailandTrinidad and TobagoTurkeyUgandaUkraineUruguayUzbekistanVenezuelaVietnamWest IndiesWestern AfricaWestern AsiaWestern EuropeYemenZaireZimbabweAzores
Czech
Race
Ancestry
AfghanAfricanAlaska NativeAlaskan AthabascanAlbanianAleutAlsatianAmericanApacheArabArapahoArgentineanArmenianAssyrian/Chaldean/SyriacAustralianAustrianBahamianBangladeshiBarbadianBasqueBelgianBelizeanBermudanBhutaneseBlackfeetBolivianBrazilianBritishBritish West IndianBulgarianBurmeseCajunCambodianCanadianCape VerdeanCarpatho RusynCelticCentral AmericanCentral American IndianCherokeeCheyenneChickasawChileanChineseChippewaChoctawColombianColvilleComancheCosta RicanCreeCreekCroatianCrowCubanCypriotCzechCzechoslovakianDanishDelawareDominicanDutchDutch West IndianEastern EuropeanEcuadorianEgyptianEnglishEstonianEthiopianEuropeanFijianFilipinoFinnishFrenchFrench American IndianFrench CanadianGermanGerman RussianGhanaianGreekGuamanian/ChamorroGuatemalanGuyaneseHaitianHmongHonduranHopiHoumaHungarianIcelanderIndian (Asian)IndonesianInupiatIranianIraqiIrishIroquoisIsraeliItalianJamaicanJapaneseJordanianKenyanKiowaKoreanLaotianLatvianLebaneseLiberianLithuanianLumbeeLuxembourgerMacedonianMalaysianMalteseMarshalleseMenomineeMexicanMexican American IndianMongolianMoroccanNative HawaiianNavajoNepaleseNew ZealanderNicaraguanNigerianNorthern EuropeanNorwegianOkinawanOsageOttawaPaiutePakistaniPalestinianPanamanianParaguayanPennsylvania GermanPeruvianPimaPolishPortuguesePotawatomiPuebloPuerto RicanPuget Sound SalishRomanianRussianSalvadoranSamoanScandinavianScotch-IrishScottishSeminoleSenegaleseShoshoneSierra LeoneanSiouxSlavicSlovakSloveneSomaliSouth AfricanSouth AmericanSouth American IndianSoviet UnionSpaniardSpanishSpanish AmericanSpanish American IndianSri LankanSubsaharan AfricanSudaneseSwedishSwissSyrianTaiwaneseThaiTlingit-HaidaTohono O'OdhamTonganTrinidadian and TobagonianTsimshianTurkishU.S. Virgin IslanderUgandanUkrainianUruguayanUteVenezuelanVietnameseWelshWest IndianYakamaYaquiYugoslavianYumanYup'ikZimbabwean
Immigration
NonimmigrantsImmigrantsAfghanistanAfricaAlbaniaArgentinaArmeniaAsiaAustraliaAustriaBahamasBangladeshBarbadosBelarusBelgiumBelizeBoliviaBosnia and HerzegovinaBrazilBulgariaBurma/MyanmarCabo VerdeCambodiaCameroonCanadaCaribbeanCentral AmericaChileChinaColombiaCongoCosta RicaCroatiaCubaCzechoslovakiaDenmarkDominicaDominican RepublicEastern AfricaEastern AsiaEastern EuropeEcuadorEgyptEl SalvadorEnglandEritreaEthiopiaEuropeFijiFranceGermanyGhanaGreeceGrenadaGuatemalaGuyanaHaitiHondurasHong KongHungaryIndiaIndonesiaIranIraqIrelandIsraelItalyJamaicaJapanJordanKazakhstanKenyaKoreaKuwaitLaosLatin AmericaLatviaLebanonLiberiaLithuaniaMalaysiaMexicoMicronesiaMiddle AfricaMoldovaMoroccoNepalNetherlandsNicaraguaNigeriaNorth AmericaNorth MacedoniaNorthern AfricaNorthern EuropeNorwayOceaniaPakistanPanamaPeruPhilippinesPolandPortugalRomaniaRussiaSaudi ArabiaScotlandSenegalSerbiaSierra LeoneSingaporeSomaliaSouth AfricaSouth AmericaSouth Central AsiaSouth Eastern AsiaSouthern EuropeSpainSri LankaSt. Vincent and the GrenadinesSudanSwedenSwitzerlandSyriaTaiwanThailandTrinidad and TobagoTurkeyUgandaUkraineUruguayUzbekistanVenezuelaVietnamWest IndiesWestern AfricaWestern AsiaWestern EuropeYemenZaireZimbabweAzores
Child Poverty Under the Age of 5
Income
Poverty
Unemployment
Labor Participation
Family Structure
Vehicle Availability
Education Level
Disability

Child Poverty Under the Age of 5 Comparison

Serbians

Czechs

Excellent
Exceptional
16.3%
CHILD POVERTY UNDER THE AGE OF 5
88.2/ 100
METRIC RATING
132nd/ 347
METRIC RANK
15.5%
CHILD POVERTY UNDER THE AGE OF 5
97.8/ 100
METRIC RATING
81st/ 347
METRIC RANK

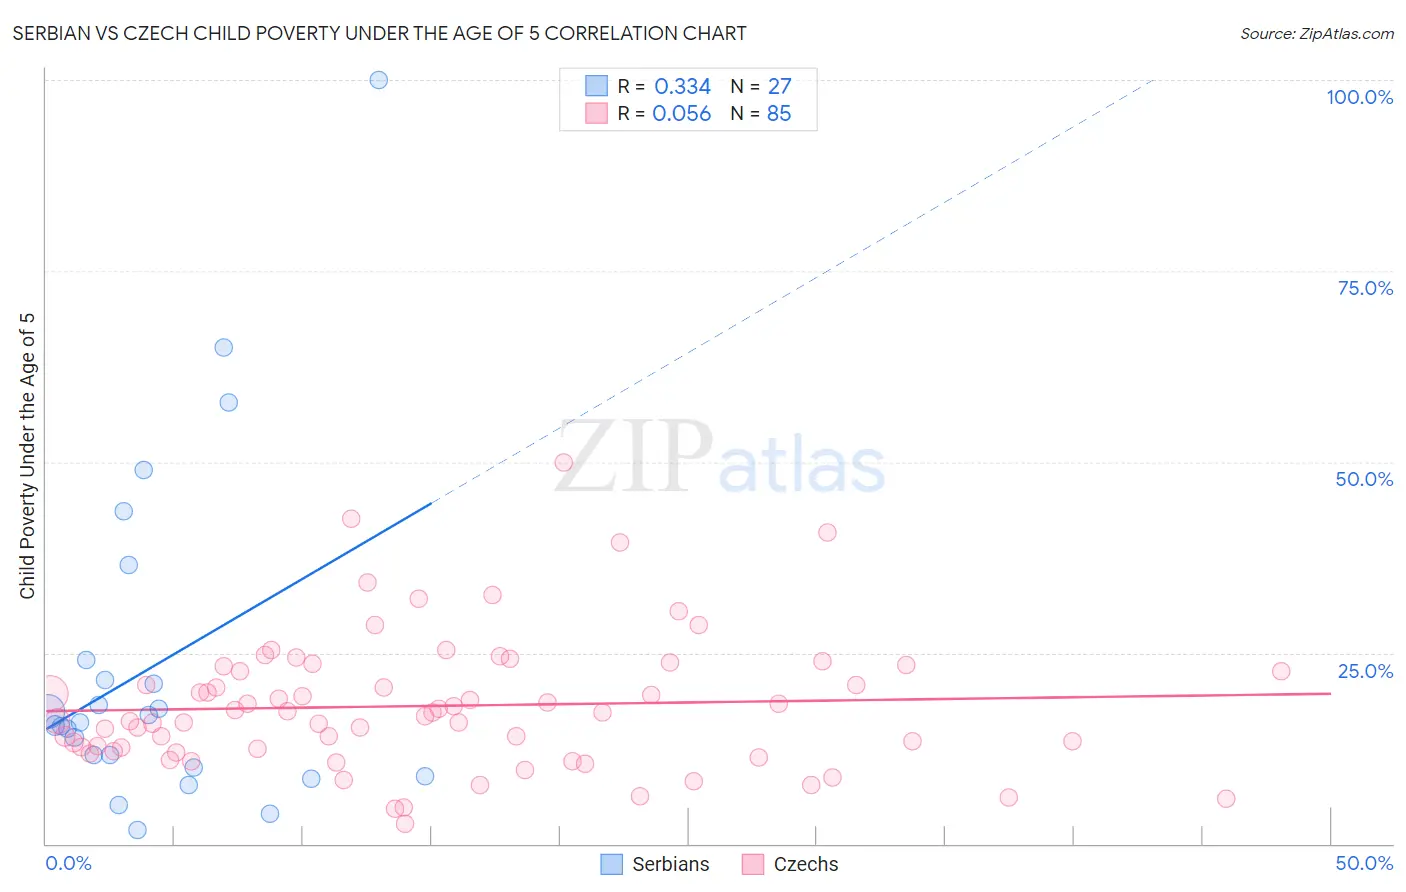
Serbian vs Czech Child Poverty Under the Age of 5 Correlation Chart

The statistical analysis conducted on geographies consisting of 257,909,998 people shows a mild positive correlation between the proportion of Serbians and poverty level among children under the age of 5 in the United States with a correlation coefficient (R) of 0.334 and weighted average of 16.3%. Similarly, the statistical analysis conducted on geographies consisting of 456,271,620 people shows a slight positive correlation between the proportion of Czechs and poverty level among children under the age of 5 in the United States with a correlation coefficient (R) of 0.056 and weighted average of 15.5%, a difference of 5.2%.
Serbian vs Czech Child Poverty Under the Age of 5

Child Poverty Under the Age of 5 Correlation Summary

MeasurementSerbianCzech
Minimum1.8%2.6%
Maximum100.0%50.0%
Range98.2%47.4%
Mean23.4%18.1%
Median15.8%17.2%
Interquartile 25% (IQ1)10.0%12.3%
Interquartile 75% (IQ3)24.0%22.9%
Interquartile Range (IQR)14.0%10.5%
Standard Deviation (Sample)22.2%8.8%
Standard Deviation (Population)21.8%8.7%

Similar Demographics by Child Poverty Under the Age of 5

Demographics Similar to Serbians by Child Poverty Under the Age of 5

In terms of child poverty under the age of 5, the demographic groups most similar to Serbians are Finnish (16.3%, a difference of 0.030%), Icelander (16.3%, a difference of 0.070%), Immigrants from North Macedonia (16.4%, a difference of 0.090%), Brazilian (16.4%, a difference of 0.10%), and Immigrants from Northern Africa (16.4%, a difference of 0.16%).
DemographicsRating | RankChild Poverty Under the Age of 5
Native Hawaiians
91.8
/100
|
#125
Exceptional
16.2%
Immigrants | Albania
91.8
/100
|
#126
Exceptional
16.2%
Immigrants | England
91.5
/100
|
#127
Exceptional
16.2%
South Africans
90.1
/100
|
#128
Exceptional
16.2%
British
89.4
/100
|
#129
Excellent
16.3%
Immigrants | Norway
89.3
/100
|
#130
Excellent
16.3%
Finns
88.3
/100
|
#131
Excellent
16.3%
Serbians
88.2
/100
|
#132
Excellent
16.3%
Icelanders
87.9
/100
|
#133
Excellent
16.3%
Immigrants | North Macedonia
87.8
/100
|
#134
Excellent
16.4%
Brazilians
87.8
/100
|
#135
Excellent
16.4%
Immigrants | Northern Africa
87.5
/100
|
#136
Excellent
16.4%
Immigrants | Chile
85.3
/100
|
#137
Excellent
16.4%
Germans
84.8
/100
|
#138
Excellent
16.5%
Immigrants | Hungary
84.5
/100
|
#139
Excellent
16.5%

Demographics Similar to Czechs by Child Poverty Under the Age of 5

In terms of child poverty under the age of 5, the demographic groups most similar to Czechs are Italian (15.5%, a difference of 0.11%), Immigrants from Italy (15.6%, a difference of 0.14%), Australian (15.5%, a difference of 0.23%), Chilean (15.6%, a difference of 0.30%), and Immigrants from Netherlands (15.6%, a difference of 0.32%).
DemographicsRating | RankChild Poverty Under the Age of 5
Argentineans
98.5
/100
|
#74
Exceptional
15.4%
Immigrants | Argentina
98.5
/100
|
#75
Exceptional
15.4%
Croatians
98.5
/100
|
#76
Exceptional
15.4%
Immigrants | Turkey
98.3
/100
|
#77
Exceptional
15.4%
Sri Lankans
98.1
/100
|
#78
Exceptional
15.5%
Australians
98.0
/100
|
#79
Exceptional
15.5%
Italians
97.9
/100
|
#80
Exceptional
15.5%
Czechs
97.8
/100
|
#81
Exceptional
15.5%
Immigrants | Italy
97.7
/100
|
#82
Exceptional
15.6%
Chileans
97.6
/100
|
#83
Exceptional
15.6%
Immigrants | Netherlands
97.6
/100
|
#84
Exceptional
15.6%
Immigrants | Latvia
97.4
/100
|
#85
Exceptional
15.6%
Immigrants | Malaysia
97.4
/100
|
#86
Exceptional
15.6%
Immigrants | Vietnam
97.4
/100
|
#87
Exceptional
15.6%
Jordanians
97.3
/100
|
#88
Exceptional
15.6%