Senegalese vs Kiowa In Labor Force | Age 30-34
COMPARE
Senegalese
Kiowa
In Labor Force | Age 30-34
In Labor Force | Age 30-34 Comparison
Senegalese
Kiowa
85.4%
IN LABOR FORCE | AGE 30-34
99.4/ 100
METRIC RATING
65th/ 347
METRIC RANK
79.8%
IN LABOR FORCE | AGE 30-34
0.0/ 100
METRIC RATING
332nd/ 347
METRIC RANK
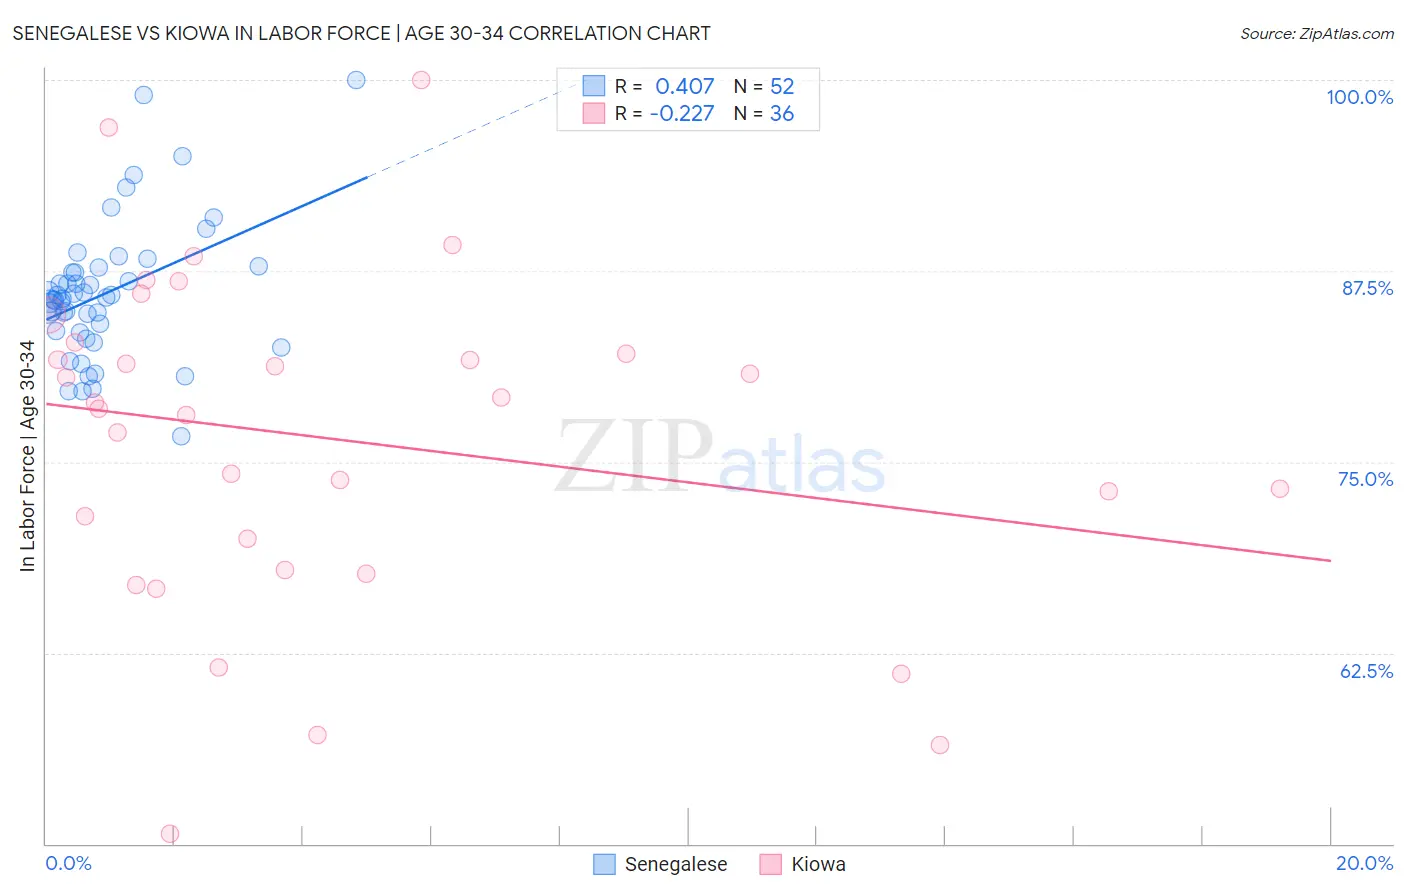
Senegalese vs Kiowa In Labor Force | Age 30-34 Correlation Chart
The statistical analysis conducted on geographies consisting of 78,106,128 people shows a moderate positive correlation between the proportion of Senegalese and labor force participation rate among population between the ages 30 and 34 in the United States with a correlation coefficient (R) of 0.407 and weighted average of 85.4%. Similarly, the statistical analysis conducted on geographies consisting of 56,095,745 people shows a weak negative correlation between the proportion of Kiowa and labor force participation rate among population between the ages 30 and 34 in the United States with a correlation coefficient (R) of -0.227 and weighted average of 79.8%, a difference of 7.0%.
In Labor Force | Age 30-34 Correlation Summary
| Measurement | Senegalese | Kiowa |
| Minimum | 76.7% | 50.7% |
| Maximum | 100.0% | 100.0% |
| Range | 23.3% | 49.3% |
| Mean | 86.1% | 76.5% |
| Median | 85.7% | 78.7% |
| Interquartile 25% (IQ1) | 83.5% | 69.0% |
| Interquartile 75% (IQ3) | 87.6% | 82.5% |
| Interquartile Range (IQR) | 4.1% | 13.5% |
| Standard Deviation (Sample) | 4.5% | 11.0% |
| Standard Deviation (Population) | 4.5% | 10.8% |
Similar Demographics by In Labor Force | Age 30-34
Demographics Similar to Senegalese by In Labor Force | Age 30-34
In terms of in labor force | age 30-34, the demographic groups most similar to Senegalese are Italian (85.4%, a difference of 0.0%), Macedonian (85.5%, a difference of 0.010%), Ghanaian (85.4%, a difference of 0.010%), Kenyan (85.4%, a difference of 0.010%), and Immigrants from Brazil (85.5%, a difference of 0.020%).
| Demographics | Rating | Rank | In Labor Force | Age 30-34 |
| Poles | 99.6 /100 | #58 | Exceptional 85.5% |
| Immigrants | Poland | 99.5 /100 | #59 | Exceptional 85.5% |
| Immigrants | France | 99.5 /100 | #60 | Exceptional 85.5% |
| Immigrants | Brazil | 99.5 /100 | #61 | Exceptional 85.5% |
| Soviet Union | 99.4 /100 | #62 | Exceptional 85.5% |
| Macedonians | 99.4 /100 | #63 | Exceptional 85.5% |
| Italians | 99.4 /100 | #64 | Exceptional 85.4% |
| Senegalese | 99.4 /100 | #65 | Exceptional 85.4% |
| Ghanaians | 99.4 /100 | #66 | Exceptional 85.4% |
| Kenyans | 99.3 /100 | #67 | Exceptional 85.4% |
| Immigrants | Eastern Europe | 99.3 /100 | #68 | Exceptional 85.4% |
| Immigrants | Iran | 99.2 /100 | #69 | Exceptional 85.4% |
| Brazilians | 99.1 /100 | #70 | Exceptional 85.4% |
| Immigrants | Japan | 99.1 /100 | #71 | Exceptional 85.4% |
| Immigrants | China | 99.0 /100 | #72 | Exceptional 85.4% |
Demographics Similar to Kiowa by In Labor Force | Age 30-34
In terms of in labor force | age 30-34, the demographic groups most similar to Kiowa are Houma (79.9%, a difference of 0.11%), Inupiat (79.7%, a difference of 0.12%), Pueblo (80.0%, a difference of 0.28%), Creek (80.4%, a difference of 0.68%), and Sioux (80.4%, a difference of 0.69%).
| Demographics | Rating | Rank | In Labor Force | Age 30-34 |
| Dutch West Indians | 0.0 /100 | #325 | Tragic 81.0% |
| Seminole | 0.0 /100 | #326 | Tragic 80.8% |
| Colville | 0.0 /100 | #327 | Tragic 80.7% |
| Sioux | 0.0 /100 | #328 | Tragic 80.4% |
| Creek | 0.0 /100 | #329 | Tragic 80.4% |
| Pueblo | 0.0 /100 | #330 | Tragic 80.0% |
| Houma | 0.0 /100 | #331 | Tragic 79.9% |
| Kiowa | 0.0 /100 | #332 | Tragic 79.8% |
| Inupiat | 0.0 /100 | #333 | Tragic 79.7% |
| Hopi | 0.0 /100 | #334 | Tragic 79.3% |
| Marshallese | 0.0 /100 | #335 | Tragic 79.2% |
| Natives/Alaskans | 0.0 /100 | #336 | Tragic 79.2% |
| Yakama | 0.0 /100 | #337 | Tragic 79.1% |
| Pima | 0.0 /100 | #338 | Tragic 79.0% |
| Apache | 0.0 /100 | #339 | Tragic 79.0% |