Senegalese vs Guatemalan In Labor Force | Age 30-34
COMPARE
Senegalese
Guatemalan
In Labor Force | Age 30-34
In Labor Force | Age 30-34 Comparison
Senegalese
Guatemalans
85.4%
IN LABOR FORCE | AGE 30-34
99.4/ 100
METRIC RATING
65th/ 347
METRIC RANK
83.7%
IN LABOR FORCE | AGE 30-34
0.2/ 100
METRIC RATING
264th/ 347
METRIC RANK
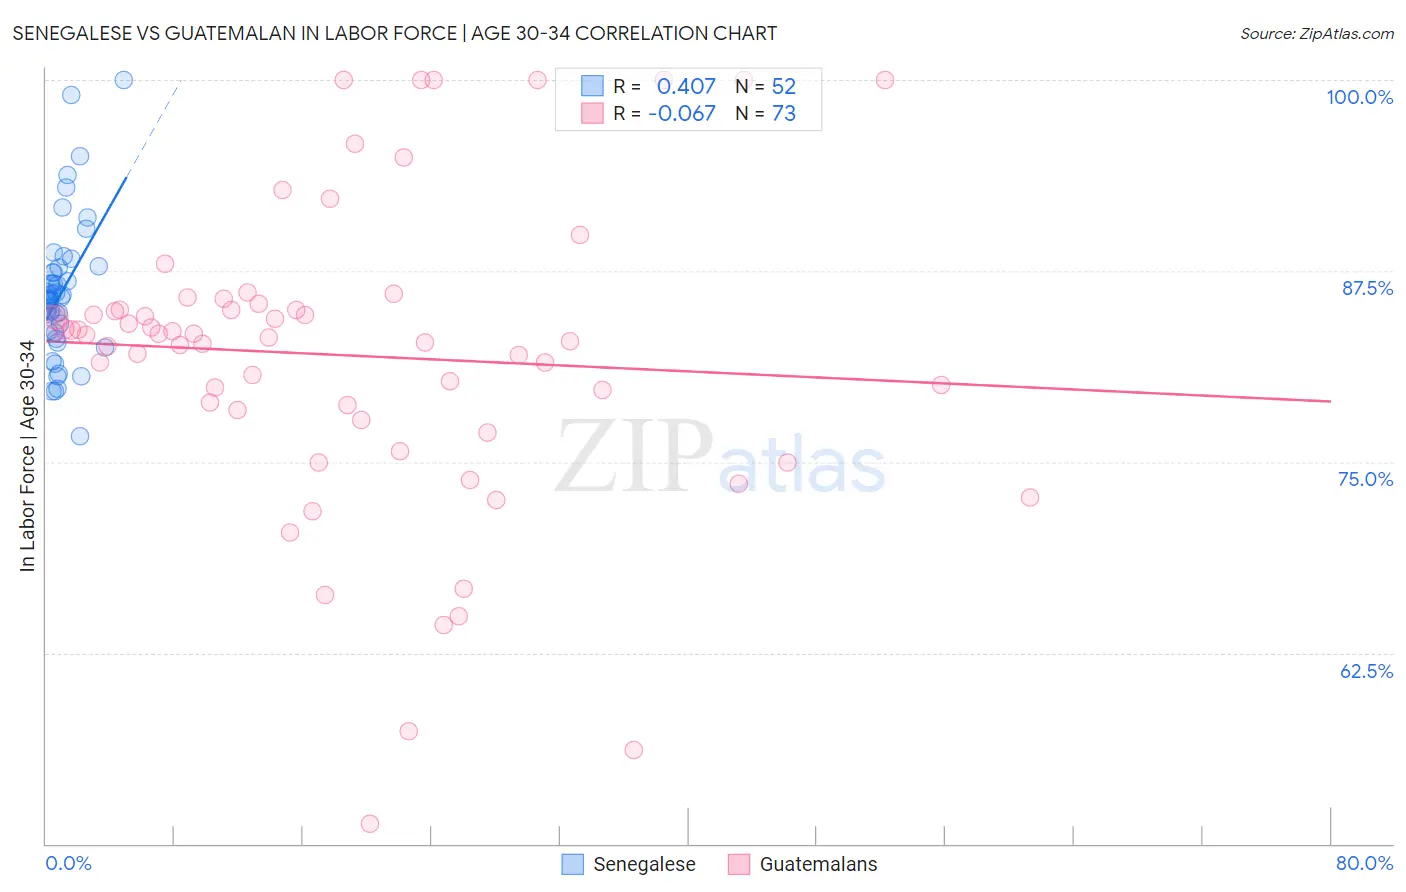
Senegalese vs Guatemalan In Labor Force | Age 30-34 Correlation Chart
The statistical analysis conducted on geographies consisting of 78,106,128 people shows a moderate positive correlation between the proportion of Senegalese and labor force participation rate among population between the ages 30 and 34 in the United States with a correlation coefficient (R) of 0.407 and weighted average of 85.4%. Similarly, the statistical analysis conducted on geographies consisting of 409,343,950 people shows a slight negative correlation between the proportion of Guatemalans and labor force participation rate among population between the ages 30 and 34 in the United States with a correlation coefficient (R) of -0.067 and weighted average of 83.7%, a difference of 2.0%.
In Labor Force | Age 30-34 Correlation Summary
| Measurement | Senegalese | Guatemalan |
| Minimum | 76.7% | 51.3% |
| Maximum | 100.0% | 100.0% |
| Range | 23.3% | 48.7% |
| Mean | 86.1% | 82.0% |
| Median | 85.7% | 83.3% |
| Interquartile 25% (IQ1) | 83.5% | 78.0% |
| Interquartile 75% (IQ3) | 87.6% | 85.1% |
| Interquartile Range (IQR) | 4.1% | 7.1% |
| Standard Deviation (Sample) | 4.5% | 10.0% |
| Standard Deviation (Population) | 4.5% | 9.9% |
Similar Demographics by In Labor Force | Age 30-34
Demographics Similar to Senegalese by In Labor Force | Age 30-34
In terms of in labor force | age 30-34, the demographic groups most similar to Senegalese are Italian (85.4%, a difference of 0.0%), Macedonian (85.5%, a difference of 0.010%), Ghanaian (85.4%, a difference of 0.010%), Kenyan (85.4%, a difference of 0.010%), and Immigrants from Brazil (85.5%, a difference of 0.020%).
| Demographics | Rating | Rank | In Labor Force | Age 30-34 |
| Poles | 99.6 /100 | #58 | Exceptional 85.5% |
| Immigrants | Poland | 99.5 /100 | #59 | Exceptional 85.5% |
| Immigrants | France | 99.5 /100 | #60 | Exceptional 85.5% |
| Immigrants | Brazil | 99.5 /100 | #61 | Exceptional 85.5% |
| Soviet Union | 99.4 /100 | #62 | Exceptional 85.5% |
| Macedonians | 99.4 /100 | #63 | Exceptional 85.5% |
| Italians | 99.4 /100 | #64 | Exceptional 85.4% |
| Senegalese | 99.4 /100 | #65 | Exceptional 85.4% |
| Ghanaians | 99.4 /100 | #66 | Exceptional 85.4% |
| Kenyans | 99.3 /100 | #67 | Exceptional 85.4% |
| Immigrants | Eastern Europe | 99.3 /100 | #68 | Exceptional 85.4% |
| Immigrants | Iran | 99.2 /100 | #69 | Exceptional 85.4% |
| Brazilians | 99.1 /100 | #70 | Exceptional 85.4% |
| Immigrants | Japan | 99.1 /100 | #71 | Exceptional 85.4% |
| Immigrants | China | 99.0 /100 | #72 | Exceptional 85.4% |
Demographics Similar to Guatemalans by In Labor Force | Age 30-34
In terms of in labor force | age 30-34, the demographic groups most similar to Guatemalans are Immigrants from Honduras (83.7%, a difference of 0.030%), Dominican (83.8%, a difference of 0.050%), Immigrants from Guyana (83.8%, a difference of 0.050%), Immigrants from Guatemala (83.7%, a difference of 0.050%), and Guyanese (83.8%, a difference of 0.070%).
| Demographics | Rating | Rank | In Labor Force | Age 30-34 |
| Iraqis | 0.3 /100 | #257 | Tragic 83.8% |
| Hondurans | 0.3 /100 | #258 | Tragic 83.8% |
| Scotch-Irish | 0.3 /100 | #259 | Tragic 83.8% |
| Immigrants | Dominican Republic | 0.3 /100 | #260 | Tragic 83.8% |
| Guyanese | 0.3 /100 | #261 | Tragic 83.8% |
| Dominicans | 0.2 /100 | #262 | Tragic 83.8% |
| Immigrants | Guyana | 0.2 /100 | #263 | Tragic 83.8% |
| Guatemalans | 0.2 /100 | #264 | Tragic 83.7% |
| Immigrants | Honduras | 0.1 /100 | #265 | Tragic 83.7% |
| Immigrants | Guatemala | 0.1 /100 | #266 | Tragic 83.7% |
| Spaniards | 0.1 /100 | #267 | Tragic 83.6% |
| Immigrants | Bangladesh | 0.1 /100 | #268 | Tragic 83.6% |
| Vietnamese | 0.1 /100 | #269 | Tragic 83.6% |
| Spanish Americans | 0.0 /100 | #270 | Tragic 83.5% |
| Spanish | 0.0 /100 | #271 | Tragic 83.5% |