Senegalese vs Latvian In Labor Force | Age 16-19
COMPARE
Senegalese
Latvian
In Labor Force | Age 16-19
In Labor Force | Age 16-19 Comparison
Senegalese
Latvians
35.9%
IN LABOR FORCE | AGE 16-19
17.4/ 100
METRIC RATING
202nd/ 347
METRIC RANK
38.9%
IN LABOR FORCE | AGE 16-19
99.4/ 100
METRIC RATING
96th/ 347
METRIC RANK
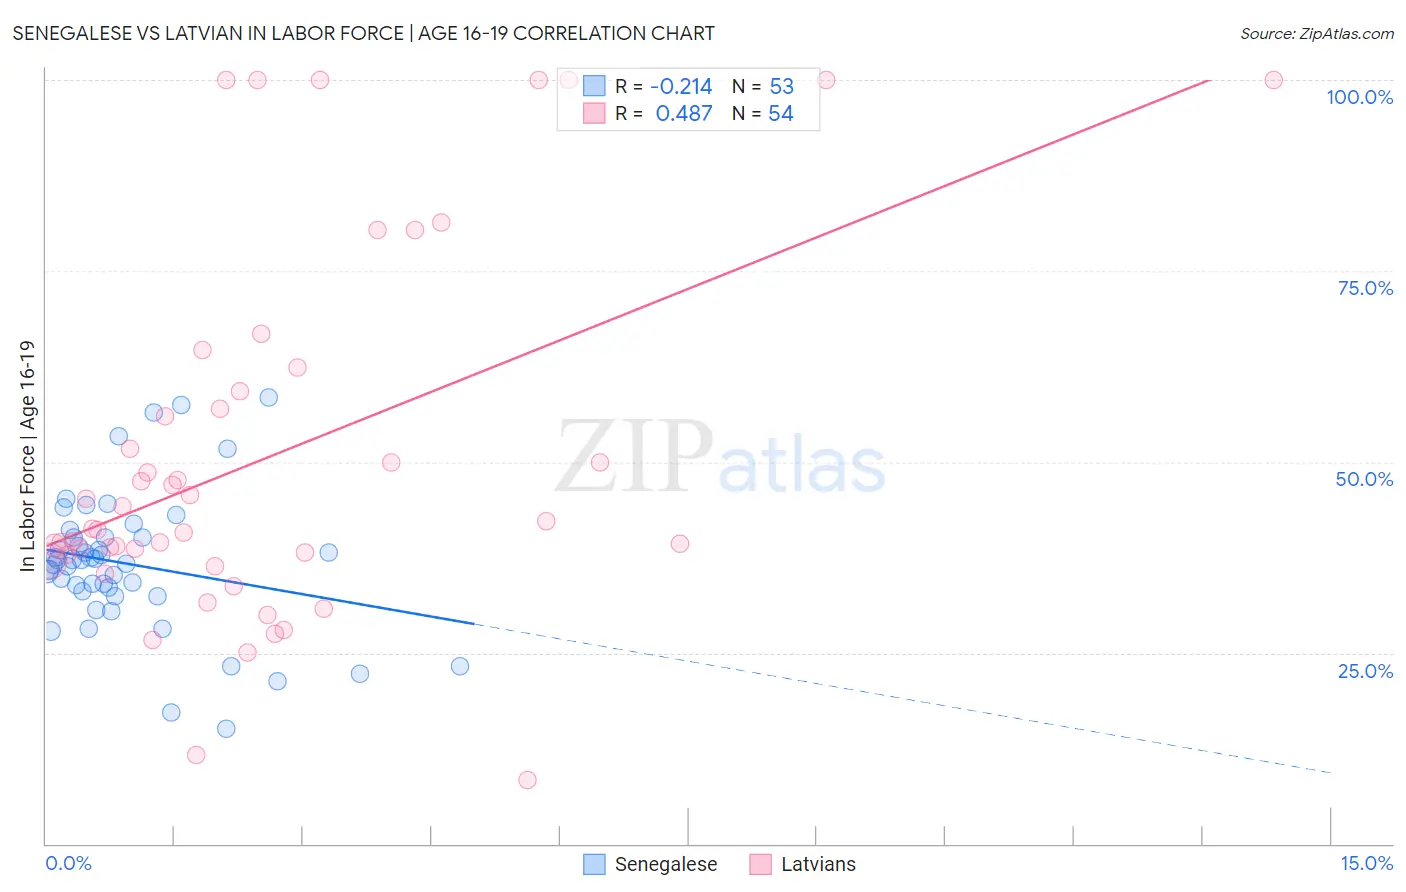
Senegalese vs Latvian In Labor Force | Age 16-19 Correlation Chart
The statistical analysis conducted on geographies consisting of 78,118,537 people shows a weak negative correlation between the proportion of Senegalese and labor force participation rate among population between the ages 16 and 19 in the United States with a correlation coefficient (R) of -0.214 and weighted average of 35.9%. Similarly, the statistical analysis conducted on geographies consisting of 220,454,154 people shows a moderate positive correlation between the proportion of Latvians and labor force participation rate among population between the ages 16 and 19 in the United States with a correlation coefficient (R) of 0.487 and weighted average of 38.9%, a difference of 8.5%.
In Labor Force | Age 16-19 Correlation Summary
| Measurement | Senegalese | Latvian |
| Minimum | 15.0% | 8.4% |
| Maximum | 58.4% | 100.0% |
| Range | 43.4% | 91.6% |
| Mean | 36.6% | 50.8% |
| Median | 37.2% | 41.8% |
| Interquartile 25% (IQ1) | 32.7% | 37.8% |
| Interquartile 75% (IQ3) | 40.1% | 59.2% |
| Interquartile Range (IQR) | 7.4% | 21.4% |
| Standard Deviation (Sample) | 9.0% | 23.9% |
| Standard Deviation (Population) | 8.9% | 23.6% |
Similar Demographics by In Labor Force | Age 16-19
Demographics Similar to Senegalese by In Labor Force | Age 16-19
In terms of in labor force | age 16-19, the demographic groups most similar to Senegalese are Alsatian (35.9%, a difference of 0.010%), Immigrants from Nigeria (35.8%, a difference of 0.060%), Immigrants from Sweden (35.9%, a difference of 0.12%), Immigrants from Norway (35.9%, a difference of 0.20%), and Immigrants from Northern Africa (35.9%, a difference of 0.21%).
| Demographics | Rating | Rank | In Labor Force | Age 16-19 |
| Bolivians | 23.3 /100 | #195 | Fair 36.0% |
| Mexican American Indians | 21.1 /100 | #196 | Fair 36.0% |
| Immigrants | Serbia | 21.0 /100 | #197 | Fair 36.0% |
| Immigrants | Northern Africa | 19.9 /100 | #198 | Poor 35.9% |
| Immigrants | Norway | 19.8 /100 | #199 | Poor 35.9% |
| Immigrants | Sweden | 18.8 /100 | #200 | Poor 35.9% |
| Alsatians | 17.5 /100 | #201 | Poor 35.9% |
| Senegalese | 17.4 /100 | #202 | Poor 35.9% |
| Immigrants | Nigeria | 16.8 /100 | #203 | Poor 35.8% |
| Immigrants | Albania | 15.0 /100 | #204 | Poor 35.8% |
| South American Indians | 14.6 /100 | #205 | Poor 35.8% |
| Chileans | 14.6 /100 | #206 | Poor 35.8% |
| Immigrants | Eastern Europe | 14.5 /100 | #207 | Poor 35.8% |
| Koreans | 13.3 /100 | #208 | Poor 35.7% |
| Moroccans | 12.7 /100 | #209 | Poor 35.7% |
Demographics Similar to Latvians by In Labor Force | Age 16-19
In terms of in labor force | age 16-19, the demographic groups most similar to Latvians are Immigrants from North America (38.9%, a difference of 0.030%), Greek (38.9%, a difference of 0.040%), Ugandan (38.9%, a difference of 0.050%), Immigrants from North Macedonia (38.9%, a difference of 0.070%), and Immigrants from Canada (38.9%, a difference of 0.12%).
| Demographics | Rating | Rank | In Labor Force | Age 16-19 |
| Alaska Natives | 99.6 /100 | #89 | Exceptional 39.1% |
| Immigrants | Burma/Myanmar | 99.5 /100 | #90 | Exceptional 39.0% |
| Spanish Americans | 99.5 /100 | #91 | Exceptional 39.0% |
| Osage | 99.4 /100 | #92 | Exceptional 39.0% |
| Blackfeet | 99.4 /100 | #93 | Exceptional 38.9% |
| Immigrants | Canada | 99.4 /100 | #94 | Exceptional 38.9% |
| Immigrants | North America | 99.4 /100 | #95 | Exceptional 38.9% |
| Latvians | 99.4 /100 | #96 | Exceptional 38.9% |
| Greeks | 99.3 /100 | #97 | Exceptional 38.9% |
| Ugandans | 99.3 /100 | #98 | Exceptional 38.9% |
| Immigrants | North Macedonia | 99.3 /100 | #99 | Exceptional 38.9% |
| Immigrants | Thailand | 99.1 /100 | #100 | Exceptional 38.7% |
| Hmong | 99.1 /100 | #101 | Exceptional 38.7% |
| Zimbabweans | 99.1 /100 | #102 | Exceptional 38.7% |
| Immigrants | Cameroon | 99.0 /100 | #103 | Exceptional 38.7% |