Seminole vs Taiwanese In Labor Force | Age 30-34
COMPARE
Seminole
Taiwanese
In Labor Force | Age 30-34
In Labor Force | Age 30-34 Comparison
Seminole
Taiwanese
80.8%
IN LABOR FORCE | AGE 30-34
0.0/ 100
METRIC RATING
326th/ 347
METRIC RANK
84.6%
IN LABOR FORCE | AGE 30-34
29.4/ 100
METRIC RATING
188th/ 347
METRIC RANK
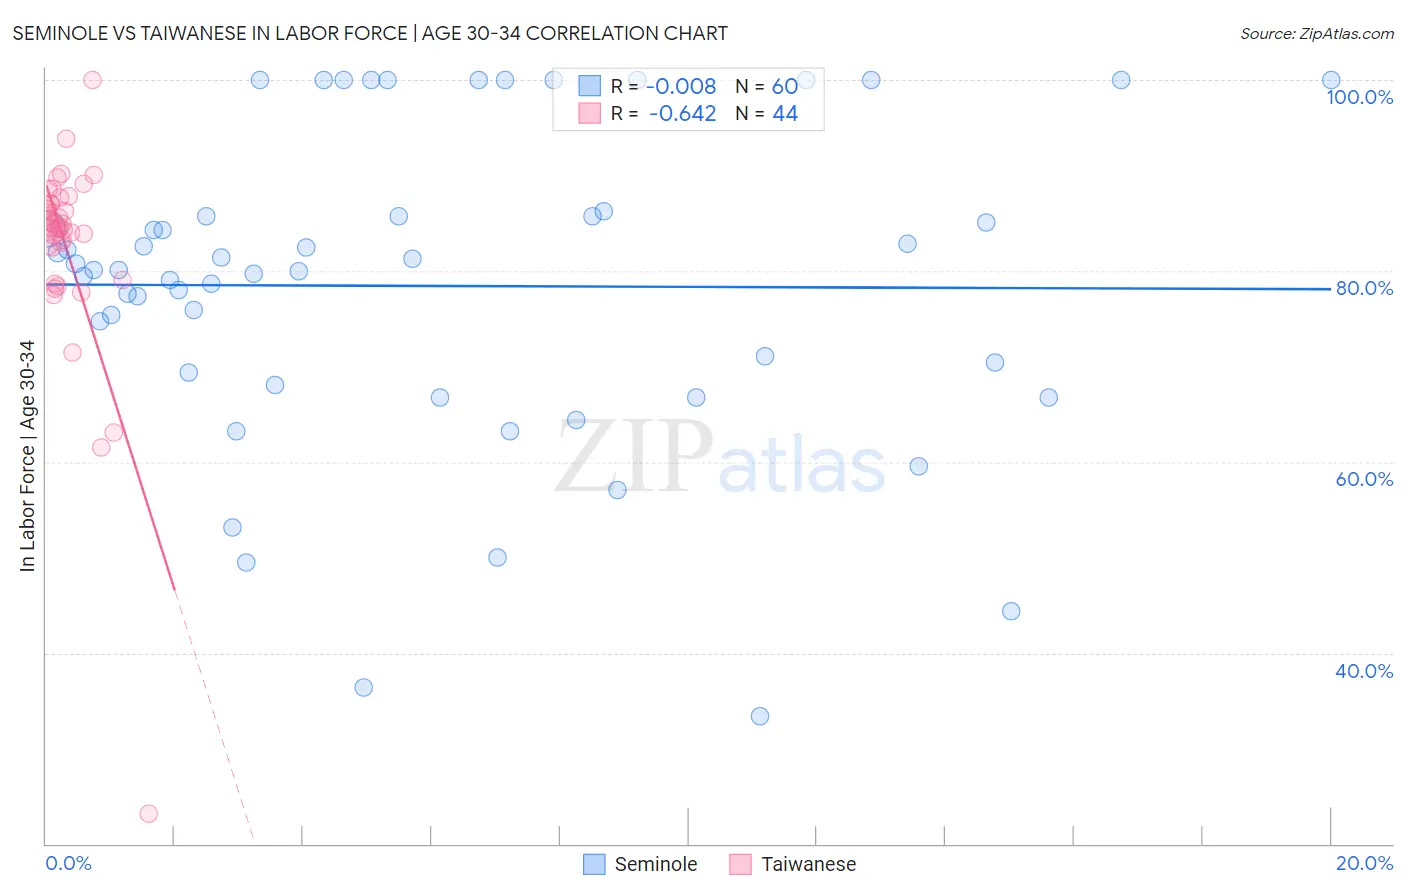
Seminole vs Taiwanese In Labor Force | Age 30-34 Correlation Chart
The statistical analysis conducted on geographies consisting of 118,296,286 people shows no correlation between the proportion of Seminole and labor force participation rate among population between the ages 30 and 34 in the United States with a correlation coefficient (R) of -0.008 and weighted average of 80.8%. Similarly, the statistical analysis conducted on geographies consisting of 31,720,118 people shows a significant negative correlation between the proportion of Taiwanese and labor force participation rate among population between the ages 30 and 34 in the United States with a correlation coefficient (R) of -0.642 and weighted average of 84.6%, a difference of 4.6%.
In Labor Force | Age 30-34 Correlation Summary
| Measurement | Seminole | Taiwanese |
| Minimum | 33.3% | 23.1% |
| Maximum | 100.0% | 100.0% |
| Range | 66.7% | 76.9% |
| Mean | 78.4% | 82.5% |
| Median | 80.0% | 84.6% |
| Interquartile 25% (IQ1) | 68.6% | 82.5% |
| Interquartile 75% (IQ3) | 85.7% | 87.0% |
| Interquartile Range (IQR) | 17.1% | 4.5% |
| Standard Deviation (Sample) | 16.5% | 11.3% |
| Standard Deviation (Population) | 16.3% | 11.2% |
Similar Demographics by In Labor Force | Age 30-34
Demographics Similar to Seminole by In Labor Force | Age 30-34
In terms of in labor force | age 30-34, the demographic groups most similar to Seminole are Colville (80.7%, a difference of 0.19%), Dutch West Indian (81.0%, a difference of 0.22%), Cheyenne (81.1%, a difference of 0.38%), Paiute (81.2%, a difference of 0.41%), and Puerto Rican (81.2%, a difference of 0.46%).
| Demographics | Rating | Rank | In Labor Force | Age 30-34 |
| Shoshone | 0.0 /100 | #319 | Tragic 81.4% |
| Yaqui | 0.0 /100 | #320 | Tragic 81.4% |
| Alaska Natives | 0.0 /100 | #321 | Tragic 81.3% |
| Puerto Ricans | 0.0 /100 | #322 | Tragic 81.2% |
| Paiute | 0.0 /100 | #323 | Tragic 81.2% |
| Cheyenne | 0.0 /100 | #324 | Tragic 81.1% |
| Dutch West Indians | 0.0 /100 | #325 | Tragic 81.0% |
| Seminole | 0.0 /100 | #326 | Tragic 80.8% |
| Colville | 0.0 /100 | #327 | Tragic 80.7% |
| Sioux | 0.0 /100 | #328 | Tragic 80.4% |
| Creek | 0.0 /100 | #329 | Tragic 80.4% |
| Pueblo | 0.0 /100 | #330 | Tragic 80.0% |
| Houma | 0.0 /100 | #331 | Tragic 79.9% |
| Kiowa | 0.0 /100 | #332 | Tragic 79.8% |
| Inupiat | 0.0 /100 | #333 | Tragic 79.7% |
Demographics Similar to Taiwanese by In Labor Force | Age 30-34
In terms of in labor force | age 30-34, the demographic groups most similar to Taiwanese are Immigrants from Congo (84.6%, a difference of 0.0%), Costa Rican (84.6%, a difference of 0.0%), Nigerian (84.5%, a difference of 0.0%), Immigrants from Philippines (84.6%, a difference of 0.020%), and Immigrants from North America (84.6%, a difference of 0.030%).
| Demographics | Rating | Rank | In Labor Force | Age 30-34 |
| Moroccans | 40.3 /100 | #181 | Average 84.6% |
| Barbadians | 36.7 /100 | #182 | Fair 84.6% |
| Immigrants | Canada | 35.0 /100 | #183 | Fair 84.6% |
| Immigrants | North America | 33.3 /100 | #184 | Fair 84.6% |
| Immigrants | Philippines | 31.5 /100 | #185 | Fair 84.6% |
| Immigrants | Congo | 29.7 /100 | #186 | Fair 84.6% |
| Costa Ricans | 29.6 /100 | #187 | Fair 84.6% |
| Taiwanese | 29.4 /100 | #188 | Fair 84.6% |
| Nigerians | 28.9 /100 | #189 | Fair 84.5% |
| Immigrants | Zaire | 25.8 /100 | #190 | Fair 84.5% |
| Hungarians | 24.8 /100 | #191 | Fair 84.5% |
| Scandinavians | 24.7 /100 | #192 | Fair 84.5% |
| Immigrants | Costa Rica | 23.9 /100 | #193 | Fair 84.5% |
| Immigrants | Afghanistan | 23.5 /100 | #194 | Fair 84.5% |
| Koreans | 23.2 /100 | #195 | Fair 84.5% |