Seminole vs Immigrants from Uganda In Labor Force | Age 35-44
COMPARE
Seminole
Immigrants from Uganda
In Labor Force | Age 35-44
In Labor Force | Age 35-44 Comparison
Seminole
Immigrants from Uganda
80.4%
IN LABOR FORCE | AGE 35-44
0.0/ 100
METRIC RATING
326th/ 347
METRIC RANK
85.0%
IN LABOR FORCE | AGE 35-44
99.3/ 100
METRIC RATING
63rd/ 347
METRIC RANK
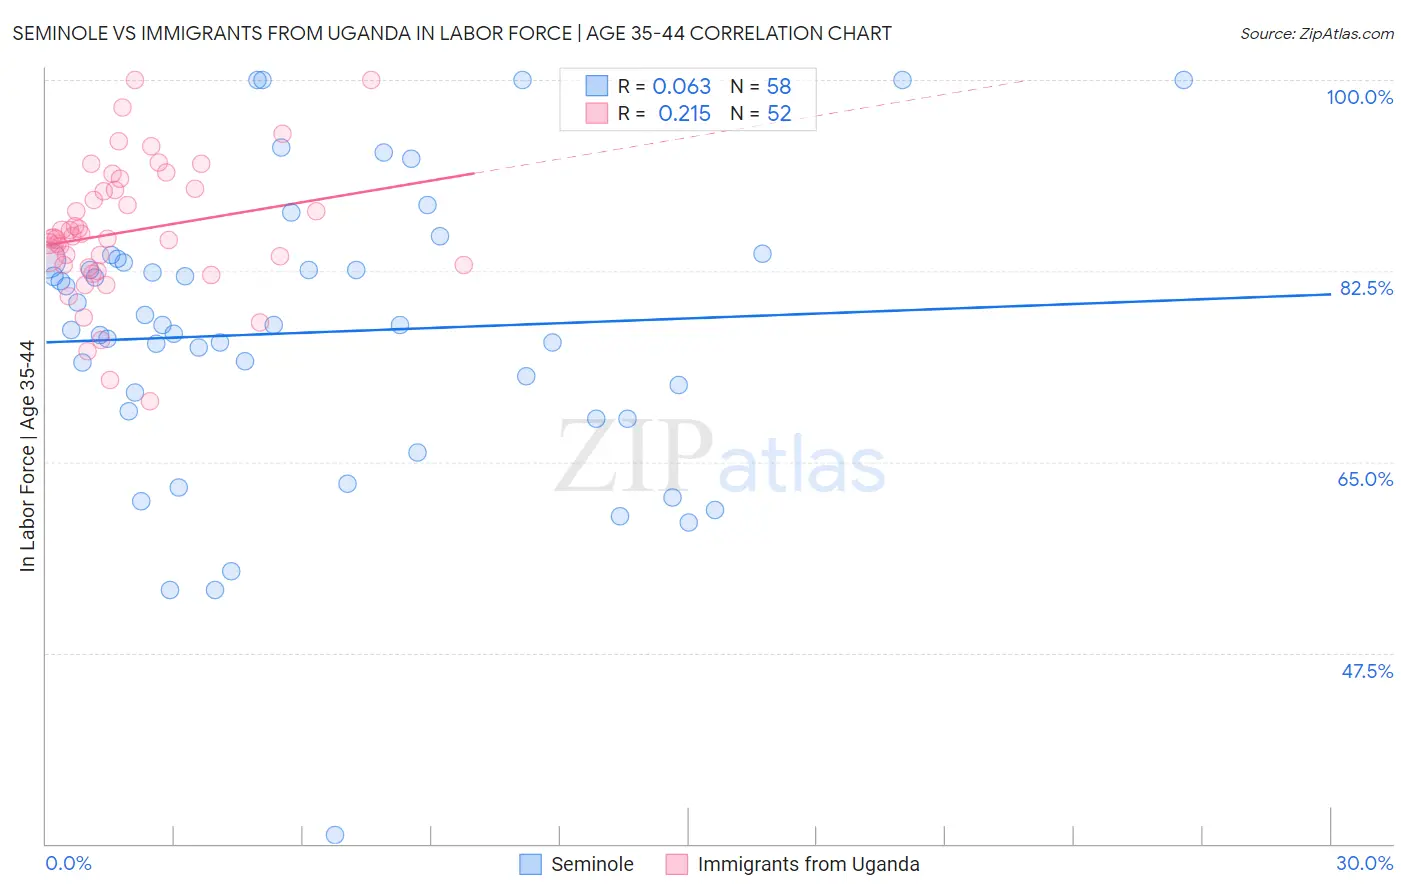
Seminole vs Immigrants from Uganda In Labor Force | Age 35-44 Correlation Chart
The statistical analysis conducted on geographies consisting of 118,299,228 people shows a slight positive correlation between the proportion of Seminole and labor force participation rate among population between the ages 35 and 44 in the United States with a correlation coefficient (R) of 0.063 and weighted average of 80.4%. Similarly, the statistical analysis conducted on geographies consisting of 125,971,479 people shows a weak positive correlation between the proportion of Immigrants from Uganda and labor force participation rate among population between the ages 35 and 44 in the United States with a correlation coefficient (R) of 0.215 and weighted average of 85.0%, a difference of 5.8%.
In Labor Force | Age 35-44 Correlation Summary
| Measurement | Seminole | Immigrants from Uganda |
| Minimum | 30.8% | 70.6% |
| Maximum | 100.0% | 100.0% |
| Range | 69.2% | 29.4% |
| Mean | 76.9% | 86.1% |
| Median | 77.5% | 85.5% |
| Interquartile 25% (IQ1) | 69.6% | 82.9% |
| Interquartile 75% (IQ3) | 83.5% | 90.0% |
| Interquartile Range (IQR) | 14.0% | 7.0% |
| Standard Deviation (Sample) | 13.3% | 6.2% |
| Standard Deviation (Population) | 13.2% | 6.1% |
Similar Demographics by In Labor Force | Age 35-44
Demographics Similar to Seminole by In Labor Force | Age 35-44
In terms of in labor force | age 35-44, the demographic groups most similar to Seminole are Dutch West Indian (80.4%, a difference of 0.040%), Sioux (80.2%, a difference of 0.17%), Choctaw (80.5%, a difference of 0.19%), Yaqui (80.5%, a difference of 0.20%), and Paiute (80.6%, a difference of 0.31%).
| Demographics | Rating | Rank | In Labor Force | Age 35-44 |
| Inupiat | 0.0 /100 | #319 | Tragic 80.9% |
| Chickasaw | 0.0 /100 | #320 | Tragic 80.9% |
| Puerto Ricans | 0.0 /100 | #321 | Tragic 80.7% |
| Paiute | 0.0 /100 | #322 | Tragic 80.6% |
| Yaqui | 0.0 /100 | #323 | Tragic 80.5% |
| Choctaw | 0.0 /100 | #324 | Tragic 80.5% |
| Dutch West Indians | 0.0 /100 | #325 | Tragic 80.4% |
| Seminole | 0.0 /100 | #326 | Tragic 80.4% |
| Sioux | 0.0 /100 | #327 | Tragic 80.2% |
| Creek | 0.0 /100 | #328 | Tragic 80.0% |
| Menominee | 0.0 /100 | #329 | Tragic 79.7% |
| Cheyenne | 0.0 /100 | #330 | Tragic 79.5% |
| Houma | 0.0 /100 | #331 | Tragic 79.5% |
| Ute | 0.0 /100 | #332 | Tragic 79.4% |
| Kiowa | 0.0 /100 | #333 | Tragic 79.2% |
Demographics Similar to Immigrants from Uganda by In Labor Force | Age 35-44
In terms of in labor force | age 35-44, the demographic groups most similar to Immigrants from Uganda are Immigrants from Moldova (85.0%, a difference of 0.0%), Immigrants from Latvia (85.0%, a difference of 0.010%), Swedish (85.0%, a difference of 0.010%), Immigrants from Brazil (85.0%, a difference of 0.020%), and Slovak (85.1%, a difference of 0.030%).
| Demographics | Rating | Rank | In Labor Force | Age 35-44 |
| Immigrants | Croatia | 99.5 /100 | #56 | Exceptional 85.1% |
| Chinese | 99.4 /100 | #57 | Exceptional 85.1% |
| Slovaks | 99.4 /100 | #58 | Exceptional 85.1% |
| Serbians | 99.4 /100 | #59 | Exceptional 85.1% |
| Albanians | 99.4 /100 | #60 | Exceptional 85.1% |
| Immigrants | Latvia | 99.3 /100 | #61 | Exceptional 85.0% |
| Immigrants | Moldova | 99.3 /100 | #62 | Exceptional 85.0% |
| Immigrants | Uganda | 99.3 /100 | #63 | Exceptional 85.0% |
| Swedes | 99.2 /100 | #64 | Exceptional 85.0% |
| Immigrants | Brazil | 99.2 /100 | #65 | Exceptional 85.0% |
| Immigrants | Haiti | 99.1 /100 | #66 | Exceptional 85.0% |
| Immigrants | Italy | 99.1 /100 | #67 | Exceptional 85.0% |
| Italians | 99.1 /100 | #68 | Exceptional 85.0% |
| Sudanese | 99.0 /100 | #69 | Exceptional 85.0% |
| Brazilians | 99.0 /100 | #70 | Exceptional 85.0% |