Seminole vs Immigrants from Senegal In Labor Force | Age 45-54
COMPARE
Seminole
Immigrants from Senegal
In Labor Force | Age 45-54
In Labor Force | Age 45-54 Comparison
Seminole
Immigrants from Senegal
78.1%
IN LABOR FORCE | AGE 45-54
0.0/ 100
METRIC RATING
326th/ 347
METRIC RANK
82.0%
IN LABOR FORCE | AGE 45-54
1.7/ 100
METRIC RATING
231st/ 347
METRIC RANK
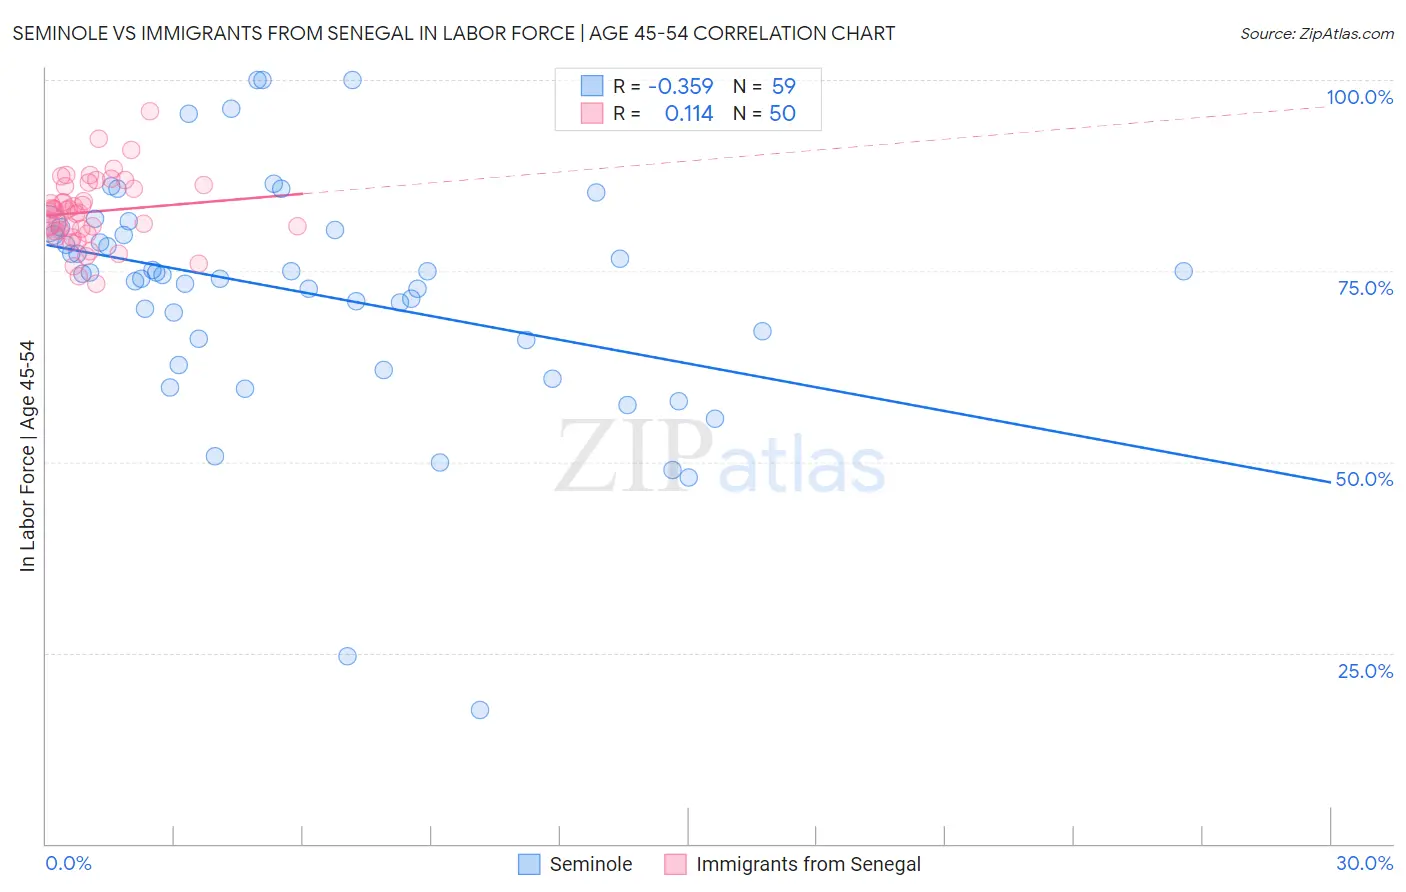
Seminole vs Immigrants from Senegal In Labor Force | Age 45-54 Correlation Chart
The statistical analysis conducted on geographies consisting of 118,297,106 people shows a mild negative correlation between the proportion of Seminole and labor force participation rate among population between the ages 45 and 54 in the United States with a correlation coefficient (R) of -0.359 and weighted average of 78.1%. Similarly, the statistical analysis conducted on geographies consisting of 90,120,202 people shows a poor positive correlation between the proportion of Immigrants from Senegal and labor force participation rate among population between the ages 45 and 54 in the United States with a correlation coefficient (R) of 0.114 and weighted average of 82.0%, a difference of 5.0%.
In Labor Force | Age 45-54 Correlation Summary
| Measurement | Seminole | Immigrants from Senegal |
| Minimum | 17.5% | 73.3% |
| Maximum | 100.0% | 95.9% |
| Range | 82.5% | 22.6% |
| Mean | 72.2% | 82.7% |
| Median | 74.7% | 82.9% |
| Interquartile 25% (IQ1) | 65.9% | 80.2% |
| Interquartile 75% (IQ3) | 80.4% | 86.1% |
| Interquartile Range (IQR) | 14.5% | 5.9% |
| Standard Deviation (Sample) | 15.5% | 4.5% |
| Standard Deviation (Population) | 15.4% | 4.5% |
Similar Demographics by In Labor Force | Age 45-54
Demographics Similar to Seminole by In Labor Force | Age 45-54
In terms of in labor force | age 45-54, the demographic groups most similar to Seminole are Cajun (78.1%, a difference of 0.0%), Choctaw (78.2%, a difference of 0.050%), Dutch West Indian (78.2%, a difference of 0.14%), Kiowa (78.3%, a difference of 0.16%), and Sioux (78.0%, a difference of 0.23%).
| Demographics | Rating | Rank | In Labor Force | Age 45-54 |
| Cherokee | 0.0 /100 | #319 | Tragic 79.0% |
| Yaqui | 0.0 /100 | #320 | Tragic 78.9% |
| Yup'ik | 0.0 /100 | #321 | Tragic 78.6% |
| Crow | 0.0 /100 | #322 | Tragic 78.3% |
| Kiowa | 0.0 /100 | #323 | Tragic 78.3% |
| Dutch West Indians | 0.0 /100 | #324 | Tragic 78.2% |
| Choctaw | 0.0 /100 | #325 | Tragic 78.2% |
| Seminole | 0.0 /100 | #326 | Tragic 78.1% |
| Cajuns | 0.0 /100 | #327 | Tragic 78.1% |
| Sioux | 0.0 /100 | #328 | Tragic 78.0% |
| Creek | 0.0 /100 | #329 | Tragic 77.7% |
| Cheyenne | 0.0 /100 | #330 | Tragic 77.6% |
| Tsimshian | 0.0 /100 | #331 | Tragic 77.4% |
| Menominee | 0.0 /100 | #332 | Tragic 77.4% |
| Natives/Alaskans | 0.0 /100 | #333 | Tragic 77.1% |
Demographics Similar to Immigrants from Senegal by In Labor Force | Age 45-54
In terms of in labor force | age 45-54, the demographic groups most similar to Immigrants from Senegal are Immigrants from Portugal (82.0%, a difference of 0.0%), Jamaican (82.0%, a difference of 0.010%), Malaysian (82.0%, a difference of 0.010%), Salvadoran (82.0%, a difference of 0.010%), and Immigrants from Burma/Myanmar (82.0%, a difference of 0.030%).
| Demographics | Rating | Rank | In Labor Force | Age 45-54 |
| Immigrants | Jamaica | 2.7 /100 | #224 | Tragic 82.1% |
| Immigrants | Oceania | 2.5 /100 | #225 | Tragic 82.1% |
| Immigrants | Caribbean | 2.5 /100 | #226 | Tragic 82.1% |
| Immigrants | Germany | 2.4 /100 | #227 | Tragic 82.1% |
| Cape Verdeans | 2.1 /100 | #228 | Tragic 82.1% |
| Immigrants | Burma/Myanmar | 1.9 /100 | #229 | Tragic 82.0% |
| Jamaicans | 1.8 /100 | #230 | Tragic 82.0% |
| Immigrants | Senegal | 1.7 /100 | #231 | Tragic 82.0% |
| Immigrants | Portugal | 1.7 /100 | #232 | Tragic 82.0% |
| Malaysians | 1.7 /100 | #233 | Tragic 82.0% |
| Salvadorans | 1.7 /100 | #234 | Tragic 82.0% |
| Sub-Saharan Africans | 1.2 /100 | #235 | Tragic 82.0% |
| Basques | 1.2 /100 | #236 | Tragic 82.0% |
| Immigrants | Trinidad and Tobago | 1.2 /100 | #237 | Tragic 82.0% |
| Trinidadians and Tobagonians | 1.1 /100 | #238 | Tragic 81.9% |