Seminole vs Immigrants from Senegal 9th Grade
COMPARE
Seminole
Immigrants from Senegal
9th Grade
9th Grade Comparison
Seminole
Immigrants from Senegal
94.8%
9TH GRADE
42.5/ 100
METRIC RATING
182nd/ 347
METRIC RANK
94.1%
9TH GRADE
0.9/ 100
METRIC RATING
252nd/ 347
METRIC RANK
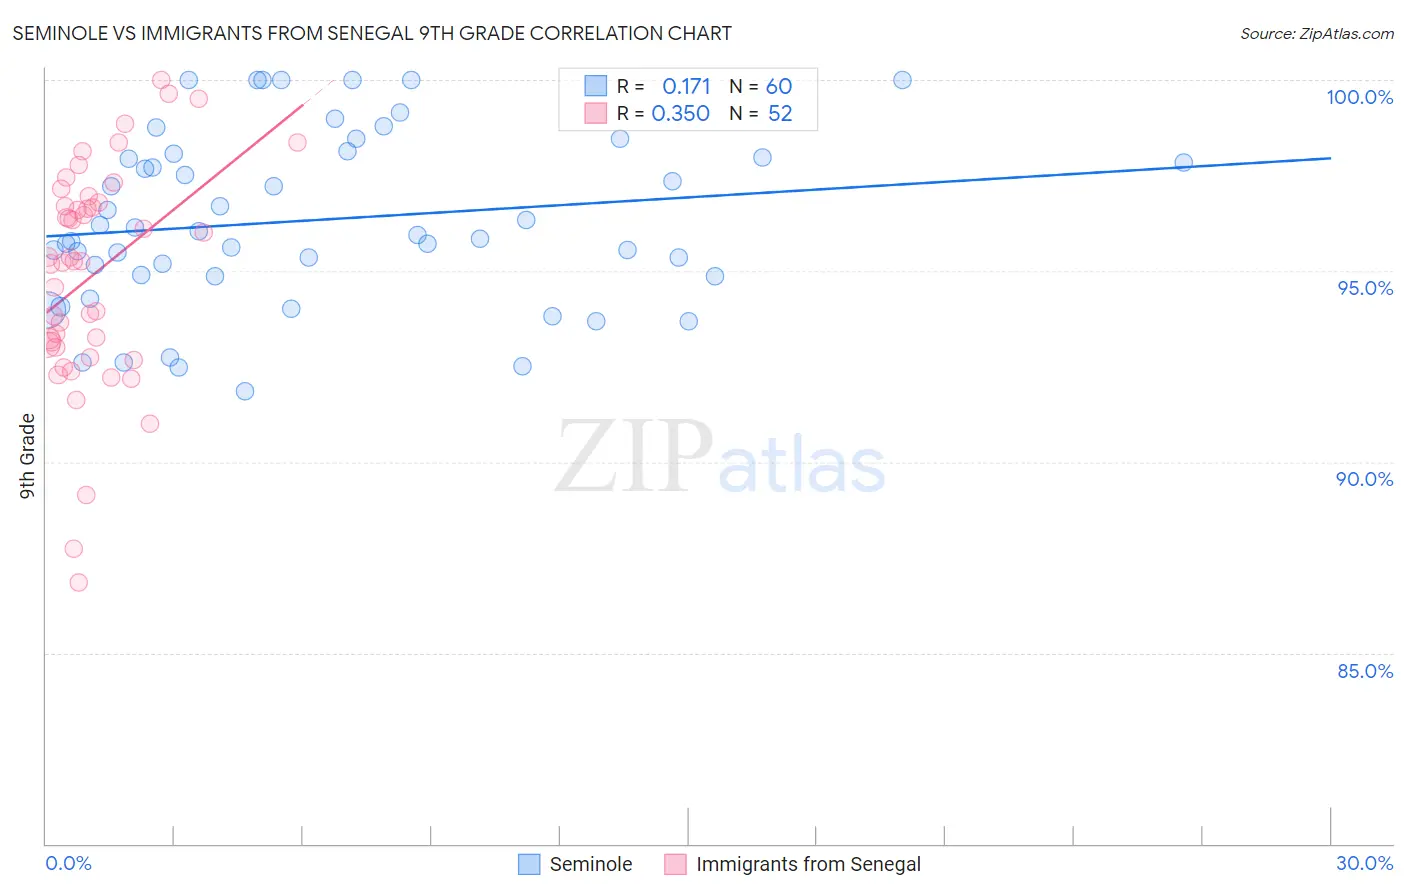
Seminole vs Immigrants from Senegal 9th Grade Correlation Chart
The statistical analysis conducted on geographies consisting of 118,314,042 people shows a poor positive correlation between the proportion of Seminole and percentage of population with at least 9th grade education in the United States with a correlation coefficient (R) of 0.171 and weighted average of 94.8%. Similarly, the statistical analysis conducted on geographies consisting of 90,130,297 people shows a mild positive correlation between the proportion of Immigrants from Senegal and percentage of population with at least 9th grade education in the United States with a correlation coefficient (R) of 0.350 and weighted average of 94.1%, a difference of 0.81%.
9th Grade Correlation Summary
| Measurement | Seminole | Immigrants from Senegal |
| Minimum | 91.9% | 86.8% |
| Maximum | 100.0% | 100.0% |
| Range | 8.1% | 13.2% |
| Mean | 96.3% | 94.9% |
| Median | 96.0% | 95.3% |
| Interquartile 25% (IQ1) | 94.9% | 93.0% |
| Interquartile 75% (IQ3) | 98.0% | 96.8% |
| Interquartile Range (IQR) | 3.1% | 3.7% |
| Standard Deviation (Sample) | 2.2% | 2.9% |
| Standard Deviation (Population) | 2.2% | 2.8% |
Similar Demographics by 9th Grade
Demographics Similar to Seminole by 9th Grade
In terms of 9th grade, the demographic groups most similar to Seminole are Immigrants from Uganda (94.8%, a difference of 0.0%), Sierra Leonean (94.8%, a difference of 0.0%), Immigrants from Nepal (94.8%, a difference of 0.020%), Immigrants from Poland (94.9%, a difference of 0.030%), and Immigrants from Venezuela (94.9%, a difference of 0.030%).
| Demographics | Rating | Rank | 9th Grade |
| Brazilians | 49.8 /100 | #175 | Average 94.9% |
| Immigrants | Spain | 49.1 /100 | #176 | Average 94.9% |
| Immigrants | Iraq | 47.8 /100 | #177 | Average 94.9% |
| Immigrants | Poland | 46.7 /100 | #178 | Average 94.9% |
| Immigrants | Venezuela | 46.5 /100 | #179 | Average 94.9% |
| Immigrants | Uganda | 43.1 /100 | #180 | Average 94.8% |
| Sierra Leoneans | 42.7 /100 | #181 | Average 94.8% |
| Seminole | 42.5 /100 | #182 | Average 94.8% |
| Immigrants | Nepal | 39.7 /100 | #183 | Fair 94.8% |
| Argentineans | 37.6 /100 | #184 | Fair 94.8% |
| Liberians | 37.4 /100 | #185 | Fair 94.8% |
| Hopi | 37.1 /100 | #186 | Fair 94.8% |
| Guamanians/Chamorros | 35.5 /100 | #187 | Fair 94.8% |
| Immigrants | Albania | 34.5 /100 | #188 | Fair 94.8% |
| Immigrants | Argentina | 34.4 /100 | #189 | Fair 94.8% |
Demographics Similar to Immigrants from Senegal by 9th Grade
In terms of 9th grade, the demographic groups most similar to Immigrants from Senegal are Jamaican (94.1%, a difference of 0.010%), Colombian (94.0%, a difference of 0.020%), U.S. Virgin Islander (94.0%, a difference of 0.050%), Immigrants from Hong Kong (94.1%, a difference of 0.060%), and Uruguayan (94.1%, a difference of 0.070%).
| Demographics | Rating | Rank | 9th Grade |
| Paiute | 1.9 /100 | #245 | Tragic 94.2% |
| Senegalese | 1.9 /100 | #246 | Tragic 94.2% |
| Afghans | 1.8 /100 | #247 | Tragic 94.2% |
| Immigrants | Somalia | 1.4 /100 | #248 | Tragic 94.1% |
| Uruguayans | 1.3 /100 | #249 | Tragic 94.1% |
| Immigrants | Hong Kong | 1.3 /100 | #250 | Tragic 94.1% |
| Jamaicans | 1.0 /100 | #251 | Tragic 94.1% |
| Immigrants | Senegal | 0.9 /100 | #252 | Tragic 94.1% |
| Colombians | 0.8 /100 | #253 | Tragic 94.0% |
| U.S. Virgin Islanders | 0.7 /100 | #254 | Tragic 94.0% |
| Immigrants | Nigeria | 0.6 /100 | #255 | Tragic 94.0% |
| Immigrants | Afghanistan | 0.5 /100 | #256 | Tragic 94.0% |
| Immigrants | Costa Rica | 0.5 /100 | #257 | Tragic 94.0% |
| Immigrants | Thailand | 0.5 /100 | #258 | Tragic 93.9% |
| Ghanaians | 0.5 /100 | #259 | Tragic 93.9% |