Seminole vs Immigrants from Laos In Labor Force | Age 45-54
COMPARE
Seminole
Immigrants from Laos
In Labor Force | Age 45-54
In Labor Force | Age 45-54 Comparison
Seminole
Immigrants from Laos
78.1%
IN LABOR FORCE | AGE 45-54
0.0/ 100
METRIC RATING
326th/ 347
METRIC RANK
81.6%
IN LABOR FORCE | AGE 45-54
0.2/ 100
METRIC RATING
254th/ 347
METRIC RANK
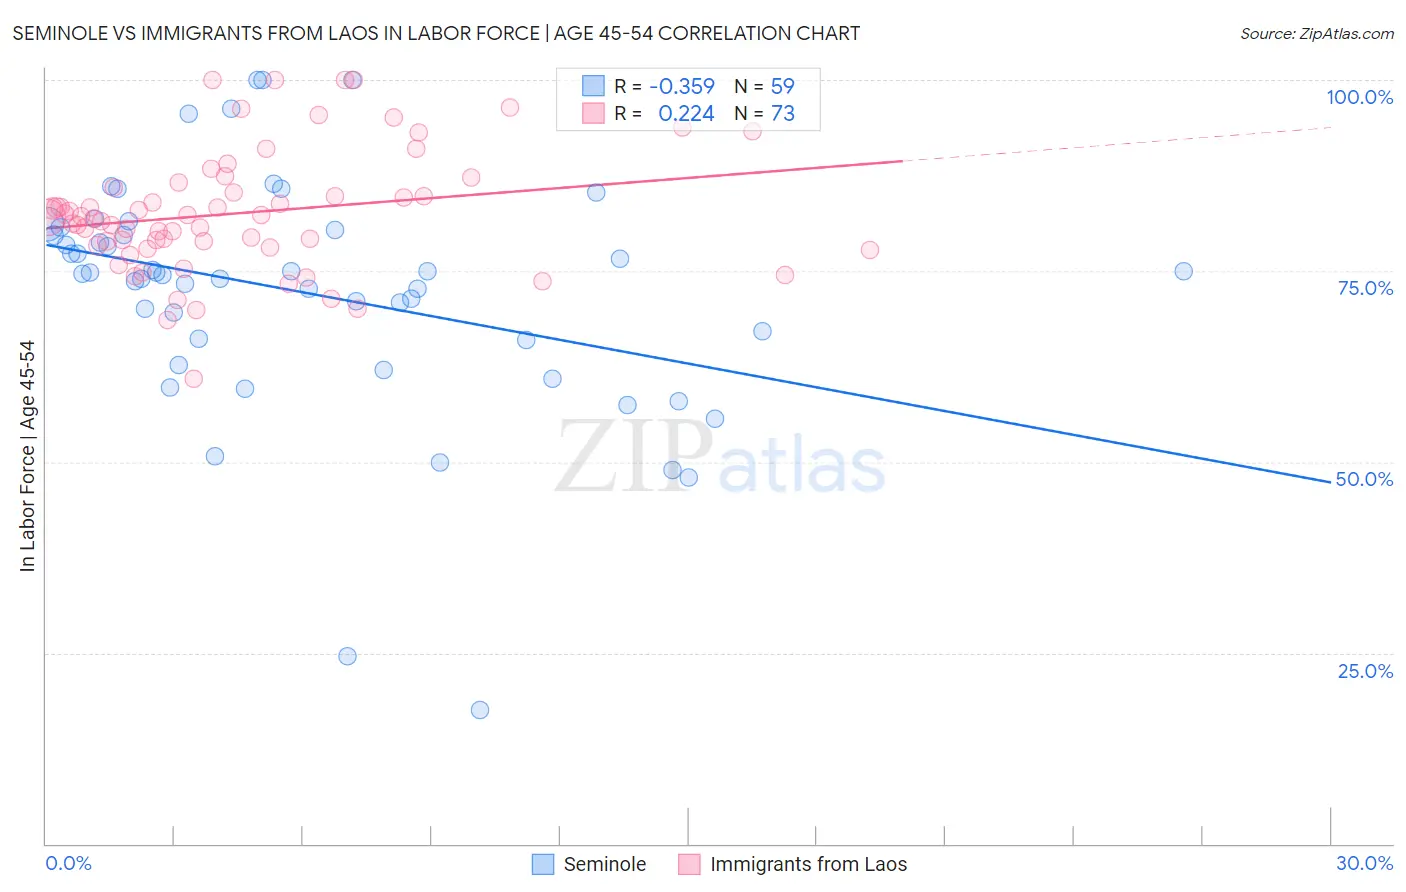
Seminole vs Immigrants from Laos In Labor Force | Age 45-54 Correlation Chart
The statistical analysis conducted on geographies consisting of 118,297,106 people shows a mild negative correlation between the proportion of Seminole and labor force participation rate among population between the ages 45 and 54 in the United States with a correlation coefficient (R) of -0.359 and weighted average of 78.1%. Similarly, the statistical analysis conducted on geographies consisting of 201,465,424 people shows a weak positive correlation between the proportion of Immigrants from Laos and labor force participation rate among population between the ages 45 and 54 in the United States with a correlation coefficient (R) of 0.224 and weighted average of 81.6%, a difference of 4.4%.
In Labor Force | Age 45-54 Correlation Summary
| Measurement | Seminole | Immigrants from Laos |
| Minimum | 17.5% | 60.9% |
| Maximum | 100.0% | 100.0% |
| Range | 82.5% | 39.1% |
| Mean | 72.2% | 82.6% |
| Median | 74.7% | 81.9% |
| Interquartile 25% (IQ1) | 65.9% | 78.2% |
| Interquartile 75% (IQ3) | 80.4% | 86.3% |
| Interquartile Range (IQR) | 14.5% | 8.2% |
| Standard Deviation (Sample) | 15.5% | 8.0% |
| Standard Deviation (Population) | 15.4% | 7.9% |
Similar Demographics by In Labor Force | Age 45-54
Demographics Similar to Seminole by In Labor Force | Age 45-54
In terms of in labor force | age 45-54, the demographic groups most similar to Seminole are Cajun (78.1%, a difference of 0.0%), Choctaw (78.2%, a difference of 0.050%), Dutch West Indian (78.2%, a difference of 0.14%), Kiowa (78.3%, a difference of 0.16%), and Sioux (78.0%, a difference of 0.23%).
| Demographics | Rating | Rank | In Labor Force | Age 45-54 |
| Cherokee | 0.0 /100 | #319 | Tragic 79.0% |
| Yaqui | 0.0 /100 | #320 | Tragic 78.9% |
| Yup'ik | 0.0 /100 | #321 | Tragic 78.6% |
| Crow | 0.0 /100 | #322 | Tragic 78.3% |
| Kiowa | 0.0 /100 | #323 | Tragic 78.3% |
| Dutch West Indians | 0.0 /100 | #324 | Tragic 78.2% |
| Choctaw | 0.0 /100 | #325 | Tragic 78.2% |
| Seminole | 0.0 /100 | #326 | Tragic 78.1% |
| Cajuns | 0.0 /100 | #327 | Tragic 78.1% |
| Sioux | 0.0 /100 | #328 | Tragic 78.0% |
| Creek | 0.0 /100 | #329 | Tragic 77.7% |
| Cheyenne | 0.0 /100 | #330 | Tragic 77.6% |
| Tsimshian | 0.0 /100 | #331 | Tragic 77.4% |
| Menominee | 0.0 /100 | #332 | Tragic 77.4% |
| Natives/Alaskans | 0.0 /100 | #333 | Tragic 77.1% |
Demographics Similar to Immigrants from Laos by In Labor Force | Age 45-54
In terms of in labor force | age 45-54, the demographic groups most similar to Immigrants from Laos are Japanese (81.6%, a difference of 0.010%), Scotch-Irish (81.6%, a difference of 0.020%), Pennsylvania German (81.6%, a difference of 0.030%), Barbadian (81.6%, a difference of 0.040%), and Guamanian/Chamorro (81.6%, a difference of 0.050%).
| Demographics | Rating | Rank | In Labor Force | Age 45-54 |
| Central Americans | 0.4 /100 | #247 | Tragic 81.7% |
| Puget Sound Salish | 0.3 /100 | #248 | Tragic 81.7% |
| Hmong | 0.3 /100 | #249 | Tragic 81.7% |
| Immigrants | Armenia | 0.2 /100 | #250 | Tragic 81.7% |
| Guamanians/Chamorros | 0.2 /100 | #251 | Tragic 81.6% |
| Pennsylvania Germans | 0.2 /100 | #252 | Tragic 81.6% |
| Japanese | 0.2 /100 | #253 | Tragic 81.6% |
| Immigrants | Laos | 0.2 /100 | #254 | Tragic 81.6% |
| Scotch-Irish | 0.2 /100 | #255 | Tragic 81.6% |
| Barbadians | 0.1 /100 | #256 | Tragic 81.6% |
| Immigrants | Congo | 0.1 /100 | #257 | Tragic 81.6% |
| Immigrants | Fiji | 0.1 /100 | #258 | Tragic 81.5% |
| Guyanese | 0.1 /100 | #259 | Tragic 81.5% |
| Spaniards | 0.1 /100 | #260 | Tragic 81.5% |
| Hawaiians | 0.1 /100 | #261 | Tragic 81.5% |