Nonimmigrants vs Immigrants from Senegal In Labor Force | Age 45-54
COMPARE
Nonimmigrants
Immigrants from Senegal
In Labor Force | Age 45-54
In Labor Force | Age 45-54 Comparison
Nonimmigrants
Immigrants from Senegal
81.2%
IN LABOR FORCE | AGE 45-54
0.0/ 100
METRIC RATING
275th/ 347
METRIC RANK
82.0%
IN LABOR FORCE | AGE 45-54
1.7/ 100
METRIC RATING
231st/ 347
METRIC RANK
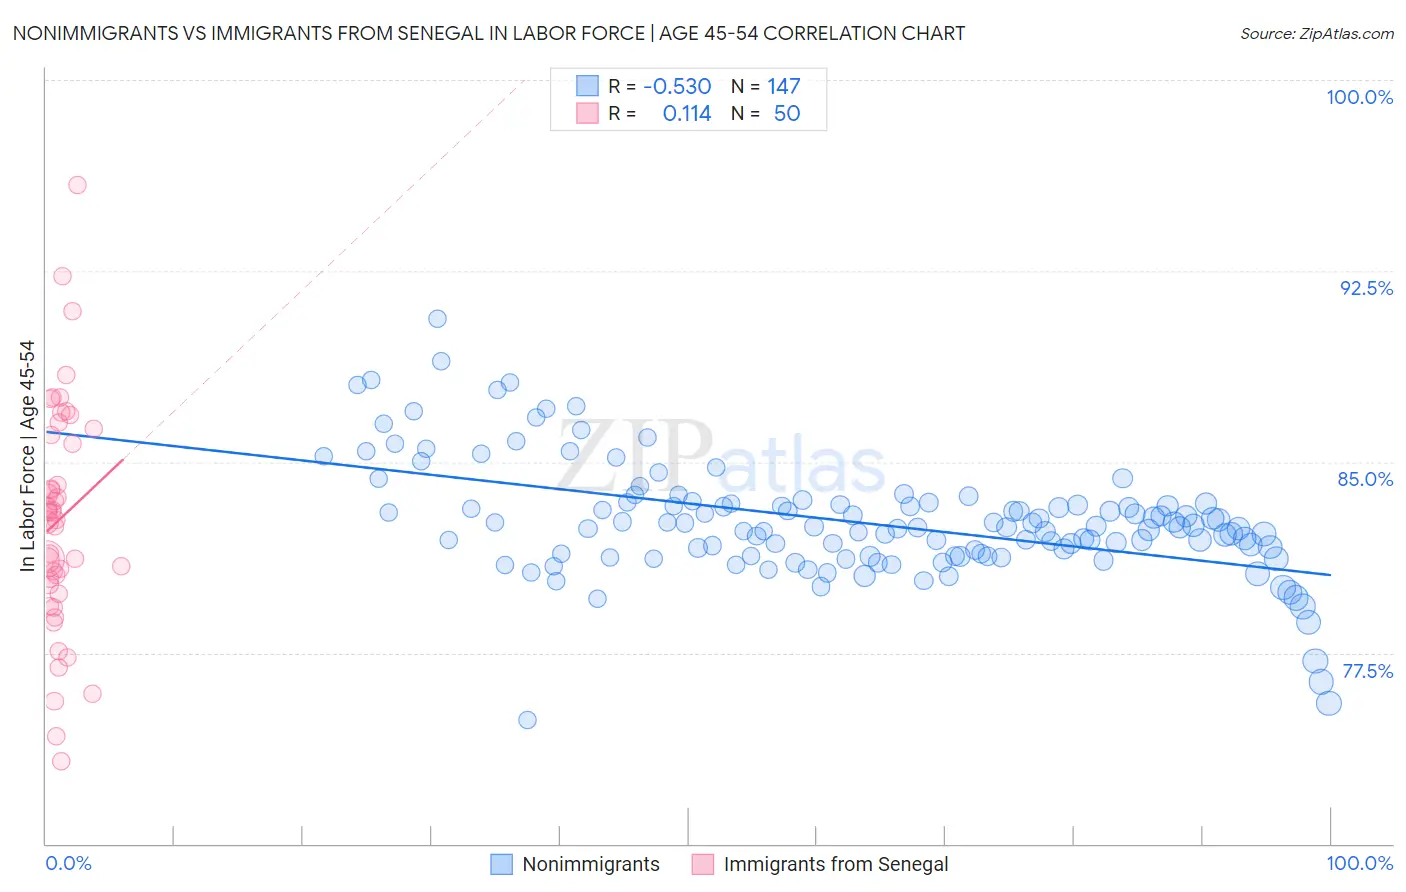
Nonimmigrants vs Immigrants from Senegal In Labor Force | Age 45-54 Correlation Chart
The statistical analysis conducted on geographies consisting of 584,054,768 people shows a substantial negative correlation between the proportion of Nonimmigrants and labor force participation rate among population between the ages 45 and 54 in the United States with a correlation coefficient (R) of -0.530 and weighted average of 81.2%. Similarly, the statistical analysis conducted on geographies consisting of 90,120,202 people shows a poor positive correlation between the proportion of Immigrants from Senegal and labor force participation rate among population between the ages 45 and 54 in the United States with a correlation coefficient (R) of 0.114 and weighted average of 82.0%, a difference of 0.98%.
In Labor Force | Age 45-54 Correlation Summary
| Measurement | Nonimmigrants | Immigrants from Senegal |
| Minimum | 74.9% | 73.3% |
| Maximum | 90.6% | 95.9% |
| Range | 15.7% | 22.6% |
| Mean | 82.6% | 82.7% |
| Median | 82.4% | 82.9% |
| Interquartile 25% (IQ1) | 81.3% | 80.2% |
| Interquartile 75% (IQ3) | 83.3% | 86.1% |
| Interquartile Range (IQR) | 2.1% | 5.9% |
| Standard Deviation (Sample) | 2.3% | 4.5% |
| Standard Deviation (Population) | 2.3% | 4.5% |
Similar Demographics by In Labor Force | Age 45-54
Demographics Similar to Nonimmigrants by In Labor Force | Age 45-54
In terms of in labor force | age 45-54, the demographic groups most similar to Nonimmigrants are British West Indian (81.2%, a difference of 0.010%), Chippewa (81.3%, a difference of 0.040%), U.S. Virgin Islander (81.2%, a difference of 0.040%), Guatemalan (81.2%, a difference of 0.060%), and Spanish (81.3%, a difference of 0.10%).
| Demographics | Rating | Rank | In Labor Force | Age 45-54 |
| Immigrants | Honduras | 0.0 /100 | #268 | Tragic 81.4% |
| Alsatians | 0.0 /100 | #269 | Tragic 81.3% |
| Bangladeshis | 0.0 /100 | #270 | Tragic 81.3% |
| Immigrants | Barbados | 0.0 /100 | #271 | Tragic 81.3% |
| Spanish | 0.0 /100 | #272 | Tragic 81.3% |
| Chippewa | 0.0 /100 | #273 | Tragic 81.3% |
| British West Indians | 0.0 /100 | #274 | Tragic 81.2% |
| Immigrants | Nonimmigrants | 0.0 /100 | #275 | Tragic 81.2% |
| U.S. Virgin Islanders | 0.0 /100 | #276 | Tragic 81.2% |
| Guatemalans | 0.0 /100 | #277 | Tragic 81.2% |
| Immigrants | Guatemala | 0.0 /100 | #278 | Tragic 81.1% |
| Immigrants | Micronesia | 0.0 /100 | #279 | Tragic 81.1% |
| Immigrants | Latin America | 0.0 /100 | #280 | Tragic 81.0% |
| Immigrants | Grenada | 0.0 /100 | #281 | Tragic 81.0% |
| Aleuts | 0.0 /100 | #282 | Tragic 81.0% |
Demographics Similar to Immigrants from Senegal by In Labor Force | Age 45-54
In terms of in labor force | age 45-54, the demographic groups most similar to Immigrants from Senegal are Immigrants from Portugal (82.0%, a difference of 0.0%), Jamaican (82.0%, a difference of 0.010%), Malaysian (82.0%, a difference of 0.010%), Salvadoran (82.0%, a difference of 0.010%), and Immigrants from Burma/Myanmar (82.0%, a difference of 0.030%).
| Demographics | Rating | Rank | In Labor Force | Age 45-54 |
| Immigrants | Jamaica | 2.7 /100 | #224 | Tragic 82.1% |
| Immigrants | Oceania | 2.5 /100 | #225 | Tragic 82.1% |
| Immigrants | Caribbean | 2.5 /100 | #226 | Tragic 82.1% |
| Immigrants | Germany | 2.4 /100 | #227 | Tragic 82.1% |
| Cape Verdeans | 2.1 /100 | #228 | Tragic 82.1% |
| Immigrants | Burma/Myanmar | 1.9 /100 | #229 | Tragic 82.0% |
| Jamaicans | 1.8 /100 | #230 | Tragic 82.0% |
| Immigrants | Senegal | 1.7 /100 | #231 | Tragic 82.0% |
| Immigrants | Portugal | 1.7 /100 | #232 | Tragic 82.0% |
| Malaysians | 1.7 /100 | #233 | Tragic 82.0% |
| Salvadorans | 1.7 /100 | #234 | Tragic 82.0% |
| Sub-Saharan Africans | 1.2 /100 | #235 | Tragic 82.0% |
| Basques | 1.2 /100 | #236 | Tragic 82.0% |
| Immigrants | Trinidad and Tobago | 1.2 /100 | #237 | Tragic 82.0% |
| Trinidadians and Tobagonians | 1.1 /100 | #238 | Tragic 81.9% |