Czech vs Indonesian In Labor Force | Age 25-29
COMPARE
Czech
Indonesian
In Labor Force | Age 25-29
In Labor Force | Age 25-29 Comparison
Czechs
Indonesians
85.6%
IN LABOR FORCE | AGE 25-29
99.8/ 100
METRIC RATING
46th/ 347
METRIC RANK
84.7%
IN LABOR FORCE | AGE 25-29
56.5/ 100
METRIC RATING
167th/ 347
METRIC RANK
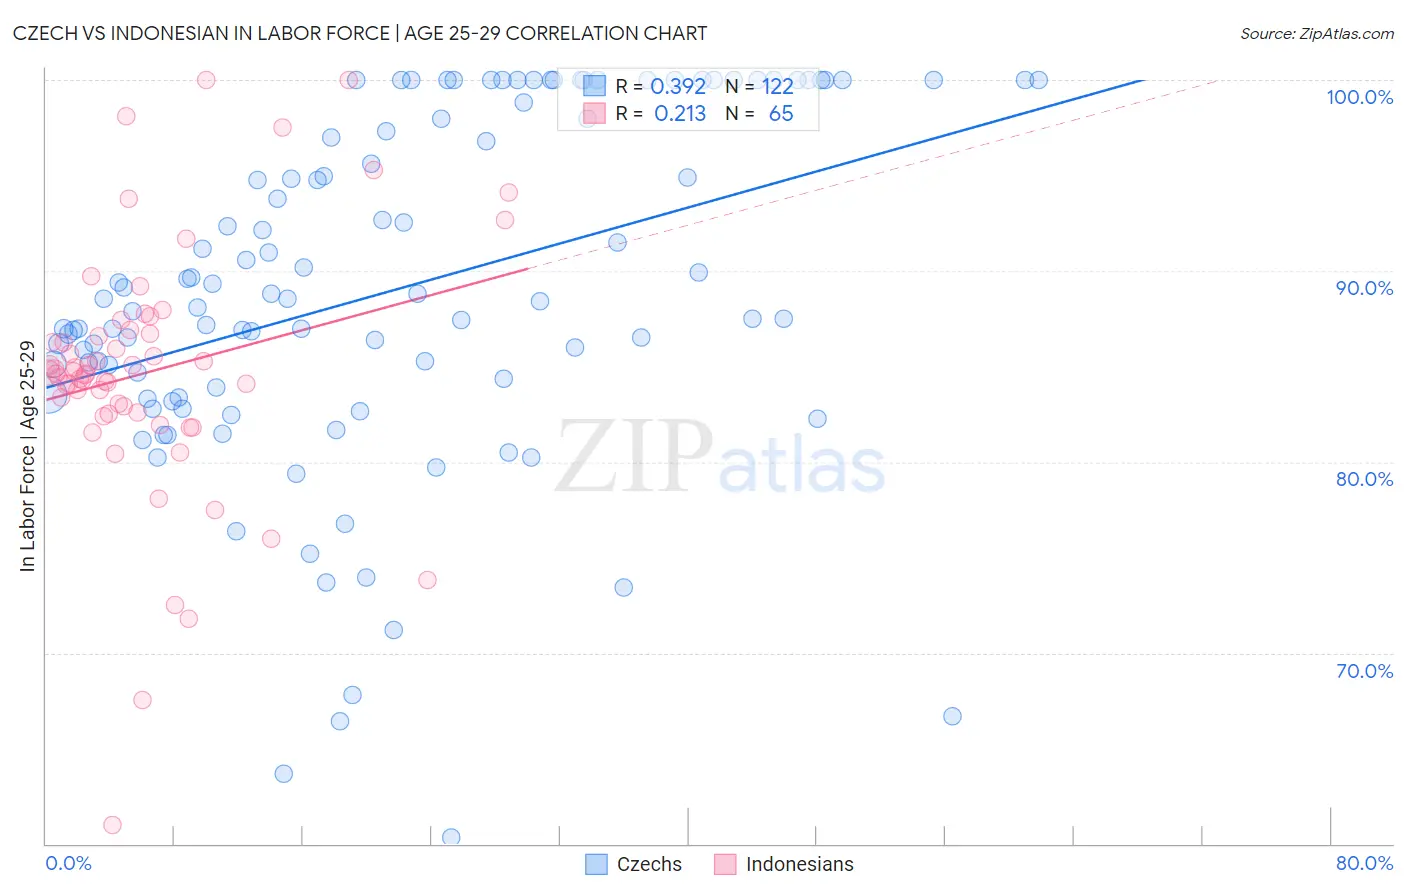
Czech vs Indonesian In Labor Force | Age 25-29 Correlation Chart
The statistical analysis conducted on geographies consisting of 484,343,470 people shows a mild positive correlation between the proportion of Czechs and labor force participation rate among population between the ages 25 and 29 in the United States with a correlation coefficient (R) of 0.392 and weighted average of 85.6%. Similarly, the statistical analysis conducted on geographies consisting of 162,720,182 people shows a weak positive correlation between the proportion of Indonesians and labor force participation rate among population between the ages 25 and 29 in the United States with a correlation coefficient (R) of 0.213 and weighted average of 84.7%, a difference of 1.1%.
In Labor Force | Age 25-29 Correlation Summary
| Measurement | Czech | Indonesian |
| Minimum | 60.3% | 61.0% |
| Maximum | 100.0% | 100.0% |
| Range | 39.7% | 39.0% |
| Mean | 89.0% | 84.7% |
| Median | 88.5% | 84.6% |
| Interquartile 25% (IQ1) | 83.5% | 82.6% |
| Interquartile 75% (IQ3) | 98.0% | 86.8% |
| Interquartile Range (IQR) | 14.5% | 4.2% |
| Standard Deviation (Sample) | 9.1% | 6.7% |
| Standard Deviation (Population) | 9.0% | 6.6% |
Similar Demographics by In Labor Force | Age 25-29
Demographics Similar to Czechs by In Labor Force | Age 25-29
In terms of in labor force | age 25-29, the demographic groups most similar to Czechs are Turkish (85.6%, a difference of 0.020%), Macedonian (85.7%, a difference of 0.030%), Immigrants from Sierra Leone (85.7%, a difference of 0.030%), Italian (85.6%, a difference of 0.030%), and Immigrants from India (85.7%, a difference of 0.040%).
| Demographics | Rating | Rank | In Labor Force | Age 25-29 |
| Croatians | 99.9 /100 | #39 | Exceptional 85.8% |
| Immigrants | Albania | 99.9 /100 | #40 | Exceptional 85.7% |
| Immigrants | Greece | 99.9 /100 | #41 | Exceptional 85.7% |
| Immigrants | Eritrea | 99.9 /100 | #42 | Exceptional 85.7% |
| Immigrants | India | 99.9 /100 | #43 | Exceptional 85.7% |
| Macedonians | 99.9 /100 | #44 | Exceptional 85.7% |
| Immigrants | Sierra Leone | 99.9 /100 | #45 | Exceptional 85.7% |
| Czechs | 99.8 /100 | #46 | Exceptional 85.6% |
| Turks | 99.8 /100 | #47 | Exceptional 85.6% |
| Italians | 99.8 /100 | #48 | Exceptional 85.6% |
| Swedes | 99.8 /100 | #49 | Exceptional 85.6% |
| Yugoslavians | 99.8 /100 | #50 | Exceptional 85.6% |
| Immigrants | Latvia | 99.8 /100 | #51 | Exceptional 85.6% |
| Immigrants | Poland | 99.7 /100 | #52 | Exceptional 85.6% |
| Belgians | 99.7 /100 | #53 | Exceptional 85.5% |
Demographics Similar to Indonesians by In Labor Force | Age 25-29
In terms of in labor force | age 25-29, the demographic groups most similar to Indonesians are Immigrants from Spain (84.7%, a difference of 0.0%), Immigrants from Colombia (84.7%, a difference of 0.010%), Argentinean (84.7%, a difference of 0.010%), Ghanaian (84.7%, a difference of 0.010%), and Immigrants from Burma/Myanmar (84.7%, a difference of 0.010%).
| Demographics | Rating | Rank | In Labor Force | Age 25-29 |
| Immigrants | Peru | 58.6 /100 | #160 | Average 84.7% |
| Canadians | 58.5 /100 | #161 | Average 84.7% |
| Immigrants | Colombia | 58.3 /100 | #162 | Average 84.7% |
| Argentineans | 57.9 /100 | #163 | Average 84.7% |
| Ghanaians | 57.6 /100 | #164 | Average 84.7% |
| Immigrants | Burma/Myanmar | 57.4 /100 | #165 | Average 84.7% |
| Immigrants | Spain | 56.9 /100 | #166 | Average 84.7% |
| Indonesians | 56.5 /100 | #167 | Average 84.7% |
| South Americans | 54.9 /100 | #168 | Average 84.7% |
| Celtics | 52.5 /100 | #169 | Average 84.7% |
| Tongans | 52.4 /100 | #170 | Average 84.7% |
| Immigrants | Vietnam | 50.5 /100 | #171 | Average 84.7% |
| Immigrants | Western Europe | 50.4 /100 | #172 | Average 84.7% |
| Assyrians/Chaldeans/Syriacs | 50.2 /100 | #173 | Average 84.7% |
| Palestinians | 50.0 /100 | #174 | Average 84.7% |