Scottish vs Immigrants from Singapore In Labor Force | Age 35-44

COMPARE

Scottish
Race
Ancestry
AfghanAfricanAlaska NativeAlaskan AthabascanAlbanianAleutAlsatianAmericanApacheArabArapahoArgentineanArmenianAssyrian/Chaldean/SyriacAustralianAustrianBahamianBangladeshiBarbadianBasqueBelgianBelizeanBermudanBhutaneseBlackfeetBolivianBrazilianBritishBritish West IndianBulgarianBurmeseCajunCambodianCanadianCape VerdeanCarpatho RusynCelticCentral AmericanCentral American IndianCherokeeCheyenneChickasawChileanChineseChippewaChoctawColombianColvilleComancheCosta RicanCreeCreekCroatianCrowCubanCypriotCzechCzechoslovakianDanishDelawareDominicanDutchDutch West IndianEastern EuropeanEcuadorianEgyptianEnglishEstonianEthiopianEuropeanFijianFilipinoFinnishFrenchFrench American IndianFrench CanadianGermanGerman RussianGhanaianGreekGuamanian/ChamorroGuatemalanGuyaneseHaitianHmongHonduranHopiHoumaHungarianIcelanderIndian (Asian)IndonesianInupiatIranianIraqiIrishIroquoisIsraeliItalianJamaicanJapaneseJordanianKenyanKiowaKoreanLaotianLatvianLebaneseLiberianLithuanianLumbeeLuxembourgerMacedonianMalaysianMalteseMarshalleseMenomineeMexicanMexican American IndianMongolianMoroccanNative HawaiianNavajoNepaleseNew ZealanderNicaraguanNigerianNorthern EuropeanNorwegianOkinawanOsageOttawaPaiutePakistaniPalestinianPanamanianParaguayanPennsylvania GermanPeruvianPimaPolishPortuguesePotawatomiPuebloPuerto RicanPuget Sound SalishRomanianRussianSalvadoranSamoanScandinavianScotch-IrishScottishSeminoleSenegaleseSerbianShoshoneSierra LeoneanSiouxSlavicSlovakSloveneSomaliSouth AfricanSouth AmericanSouth American IndianSoviet UnionSpaniardSpanishSpanish AmericanSpanish American IndianSri LankanSubsaharan AfricanSudaneseSwedishSwissSyrianTaiwaneseThaiTlingit-HaidaTohono O'OdhamTonganTrinidadian and TobagonianTsimshianTurkishU.S. Virgin IslanderUgandanUkrainianUruguayanUteVenezuelanVietnameseWelshWest IndianYakamaYaquiYugoslavianYumanYup'ikZimbabwean
Immigration
NonimmigrantsImmigrantsAfghanistanAfricaAlbaniaArgentinaArmeniaAsiaAustraliaAustriaBahamasBangladeshBarbadosBelarusBelgiumBelizeBoliviaBosnia and HerzegovinaBrazilBulgariaBurma/MyanmarCabo VerdeCambodiaCameroonCanadaCaribbeanCentral AmericaChileChinaColombiaCongoCosta RicaCroatiaCubaCzechoslovakiaDenmarkDominicaDominican RepublicEastern AfricaEastern AsiaEastern EuropeEcuadorEgyptEl SalvadorEnglandEritreaEthiopiaEuropeFijiFranceGermanyGhanaGreeceGrenadaGuatemalaGuyanaHaitiHondurasHong KongHungaryIndiaIndonesiaIranIraqIrelandIsraelItalyJamaicaJapanJordanKazakhstanKenyaKoreaKuwaitLaosLatin AmericaLatviaLebanonLiberiaLithuaniaMalaysiaMexicoMicronesiaMiddle AfricaMoldovaMoroccoNepalNetherlandsNicaraguaNigeriaNorth AmericaNorth MacedoniaNorthern AfricaNorthern EuropeNorwayOceaniaPakistanPanamaPeruPhilippinesPolandPortugalRomaniaRussiaSaudi ArabiaScotlandSenegalSerbiaSierra LeoneSomaliaSouth AfricaSouth AmericaSouth Central AsiaSouth Eastern AsiaSouthern EuropeSpainSri LankaSt. Vincent and the GrenadinesSudanSwedenSwitzerlandSyriaTaiwanThailandTrinidad and TobagoTurkeyUgandaUkraineUruguayUzbekistanVenezuelaVietnamWest IndiesWestern AfricaWestern AsiaWestern EuropeYemenZaireZimbabweAzores
Immigrants from Singapore
Race
Ancestry
AfghanAfricanAlaska NativeAlaskan AthabascanAlbanianAleutAlsatianAmericanApacheArabArapahoArgentineanArmenianAssyrian/Chaldean/SyriacAustralianAustrianBahamianBangladeshiBarbadianBasqueBelgianBelizeanBermudanBhutaneseBlackfeetBolivianBrazilianBritishBritish West IndianBulgarianBurmeseCajunCambodianCanadianCape VerdeanCarpatho RusynCelticCentral AmericanCentral American IndianCherokeeCheyenneChickasawChileanChineseChippewaChoctawColombianColvilleComancheCosta RicanCreeCreekCroatianCrowCubanCypriotCzechCzechoslovakianDanishDelawareDominicanDutchDutch West IndianEastern EuropeanEcuadorianEgyptianEnglishEstonianEthiopianEuropeanFijianFilipinoFinnishFrenchFrench American IndianFrench CanadianGermanGerman RussianGhanaianGreekGuamanian/ChamorroGuatemalanGuyaneseHaitianHmongHonduranHopiHoumaHungarianIcelanderIndian (Asian)IndonesianInupiatIranianIraqiIrishIroquoisIsraeliItalianJamaicanJapaneseJordanianKenyanKiowaKoreanLaotianLatvianLebaneseLiberianLithuanianLumbeeLuxembourgerMacedonianMalaysianMalteseMarshalleseMenomineeMexicanMexican American IndianMongolianMoroccanNative HawaiianNavajoNepaleseNew ZealanderNicaraguanNigerianNorthern EuropeanNorwegianOkinawanOsageOttawaPaiutePakistaniPalestinianPanamanianParaguayanPennsylvania GermanPeruvianPimaPolishPortuguesePotawatomiPuebloPuerto RicanPuget Sound SalishRomanianRussianSalvadoranSamoanScandinavianScotch-IrishSeminoleSenegaleseSerbianShoshoneSierra LeoneanSiouxSlavicSlovakSloveneSomaliSouth AfricanSouth AmericanSouth American IndianSoviet UnionSpaniardSpanishSpanish AmericanSpanish American IndianSri LankanSubsaharan AfricanSudaneseSwedishSwissSyrianTaiwaneseThaiTlingit-HaidaTohono O'OdhamTonganTrinidadian and TobagonianTsimshianTurkishU.S. Virgin IslanderUgandanUkrainianUruguayanUteVenezuelanVietnameseWelshWest IndianYakamaYaquiYugoslavianYumanYup'ikZimbabwean
Immigration
NonimmigrantsImmigrantsAfghanistanAfricaAlbaniaArgentinaArmeniaAsiaAustraliaAustriaBahamasBangladeshBarbadosBelarusBelgiumBelizeBoliviaBosnia and HerzegovinaBrazilBulgariaBurma/MyanmarCabo VerdeCambodiaCameroonCanadaCaribbeanCentral AmericaChileChinaColombiaCongoCosta RicaCroatiaCubaCzechoslovakiaDenmarkDominicaDominican RepublicEastern AfricaEastern AsiaEastern EuropeEcuadorEgyptEl SalvadorEnglandEritreaEthiopiaEuropeFijiFranceGermanyGhanaGreeceGrenadaGuatemalaGuyanaHaitiHondurasHong KongHungaryIndiaIndonesiaIranIraqIrelandIsraelItalyJamaicaJapanJordanKazakhstanKenyaKoreaKuwaitLaosLatin AmericaLatviaLebanonLiberiaLithuaniaMalaysiaMexicoMicronesiaMiddle AfricaMoldovaMoroccoNepalNetherlandsNicaraguaNigeriaNorth AmericaNorth MacedoniaNorthern AfricaNorthern EuropeNorwayOceaniaPakistanPanamaPeruPhilippinesPolandPortugalRomaniaRussiaSaudi ArabiaScotlandSenegalSerbiaSierra LeoneSingaporeSomaliaSouth AfricaSouth AmericaSouth Central AsiaSouth Eastern AsiaSouthern EuropeSpainSri LankaSt. Vincent and the GrenadinesSudanSwedenSwitzerlandSyriaTaiwanThailandTrinidad and TobagoTurkeyUgandaUkraineUruguayUzbekistanVenezuelaVietnamWest IndiesWestern AfricaWestern AsiaWestern EuropeYemenZaireZimbabweAzores
In Labor Force | Age 35-44
Income
Poverty
Unemployment
Labor Participation
Family Structure
Vehicle Availability
Education Level
Disability

In Labor Force | Age 35-44 Comparison

Scottish

Immigrants from Singapore

Tragic
Exceptional
83.9%
IN LABOR FORCE | AGE 35-44
3.2/ 100
METRIC RATING
231st/ 347
METRIC RANK
85.0%
IN LABOR FORCE | AGE 35-44
98.9/ 100
METRIC RATING
72nd/ 347
METRIC RANK

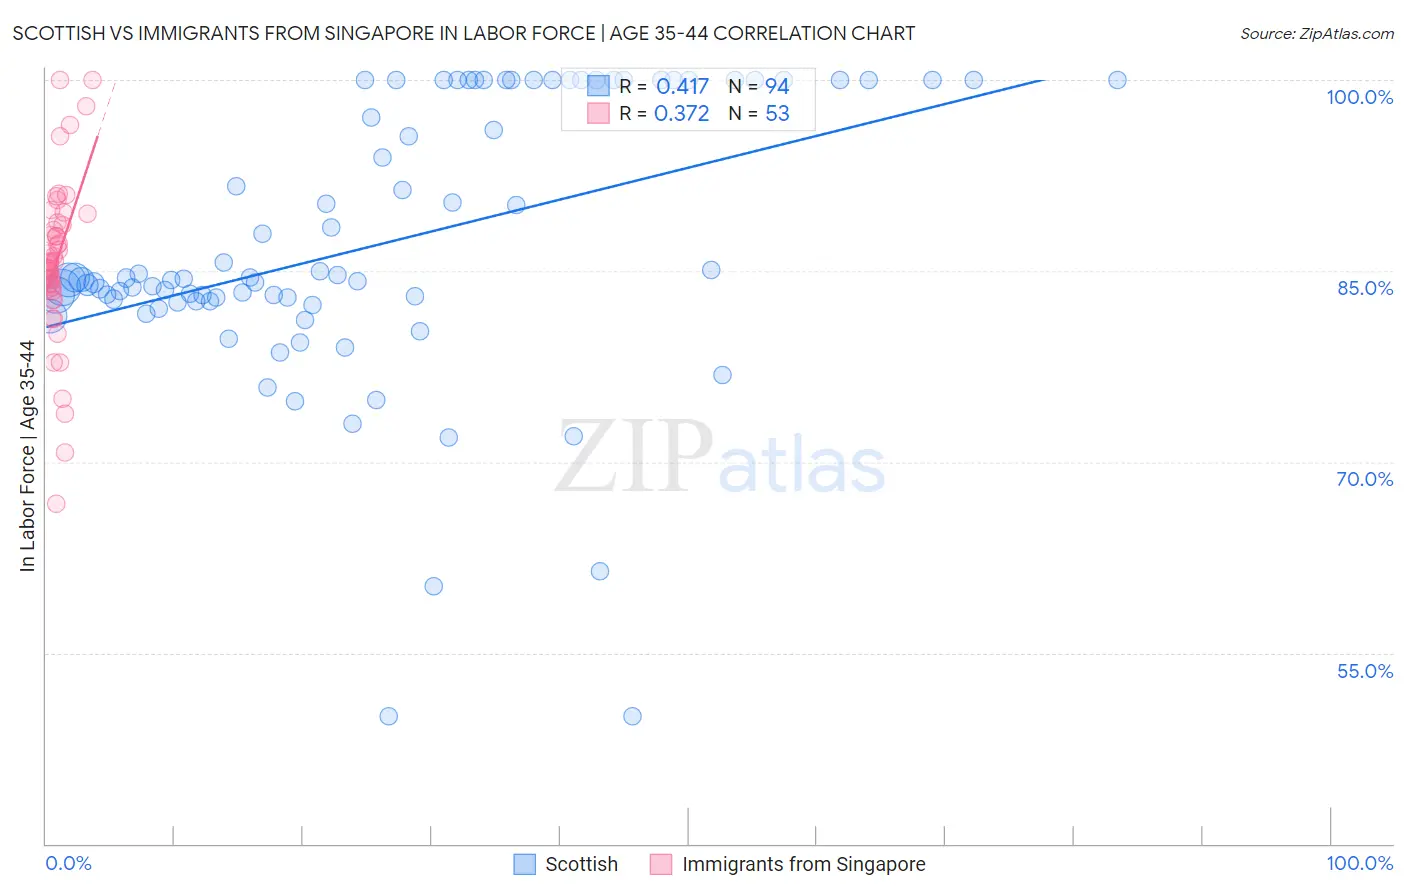
Scottish vs Immigrants from Singapore In Labor Force | Age 35-44 Correlation Chart

The statistical analysis conducted on geographies consisting of 566,464,566 people shows a moderate positive correlation between the proportion of Scottish and labor force participation rate among population between the ages 35 and 44 in the United States with a correlation coefficient (R) of 0.417 and weighted average of 83.9%. Similarly, the statistical analysis conducted on geographies consisting of 137,454,935 people shows a mild positive correlation between the proportion of Immigrants from Singapore and labor force participation rate among population between the ages 35 and 44 in the United States with a correlation coefficient (R) of 0.372 and weighted average of 85.0%, a difference of 1.3%.
Scottish vs Immigrants from Singapore In Labor Force | Age 35-44

In Labor Force | Age 35-44 Correlation Summary

MeasurementScottishImmigrants from Singapore
Minimum50.0%66.7%
Maximum100.0%100.0%
Range50.0%33.3%
Mean87.1%85.7%
Median84.4%85.7%
Interquartile 25% (IQ1)82.6%83.8%
Interquartile 75% (IQ3)100.0%88.7%
Interquartile Range (IQR)17.4%4.9%
Standard Deviation (Sample)10.9%6.3%
Standard Deviation (Population)10.8%6.2%

Similar Demographics by In Labor Force | Age 35-44

Demographics Similar to Scottish by In Labor Force | Age 35-44

In terms of in labor force | age 35-44, the demographic groups most similar to Scottish are Native Hawaiian (83.9%, a difference of 0.010%), Immigrants from Germany (83.9%, a difference of 0.020%), Immigrants from Iraq (83.9%, a difference of 0.030%), Immigrants from Oceania (83.9%, a difference of 0.030%), and Immigrants from Syria (83.9%, a difference of 0.040%).
DemographicsRating | RankIn Labor Force | Age 35-44
U.S. Virgin Islanders
6.1
/100
|
#224
Tragic
84.0%
Immigrants | Burma/Myanmar
6.1
/100
|
#225
Tragic
84.0%
Panamanians
5.4
/100
|
#226
Tragic
84.0%
British West Indians
5.3
/100
|
#227
Tragic
84.0%
Welsh
5.3
/100
|
#228
Tragic
84.0%
Immigrants | Thailand
4.7
/100
|
#229
Tragic
84.0%
Immigrants | Iraq
3.7
/100
|
#230
Tragic
83.9%
Scottish
3.2
/100
|
#231
Tragic
83.9%
Native Hawaiians
3.0
/100
|
#232
Tragic
83.9%
Immigrants | Germany
2.8
/100
|
#233
Tragic
83.9%
Immigrants | Oceania
2.6
/100
|
#234
Tragic
83.9%
Immigrants | Syria
2.5
/100
|
#235
Tragic
83.9%
West Indians
2.4
/100
|
#236
Tragic
83.9%
English
1.8
/100
|
#237
Tragic
83.8%
Immigrants | Laos
1.7
/100
|
#238
Tragic
83.8%

Demographics Similar to Immigrants from Singapore by In Labor Force | Age 35-44

In terms of in labor force | age 35-44, the demographic groups most similar to Immigrants from Singapore are Immigrants from Sri Lanka (85.0%, a difference of 0.0%), Colombian (85.0%, a difference of 0.010%), Brazilian (85.0%, a difference of 0.020%), Russian (85.0%, a difference of 0.020%), and Immigrants from South Central Asia (85.0%, a difference of 0.020%).
DemographicsRating | RankIn Labor Force | Age 35-44
Immigrants | Brazil
99.2
/100
|
#65
Exceptional
85.0%
Immigrants | Haiti
99.1
/100
|
#66
Exceptional
85.0%
Immigrants | Italy
99.1
/100
|
#67
Exceptional
85.0%
Italians
99.1
/100
|
#68
Exceptional
85.0%
Sudanese
99.0
/100
|
#69
Exceptional
85.0%
Brazilians
99.0
/100
|
#70
Exceptional
85.0%
Russians
99.0
/100
|
#71
Exceptional
85.0%
Immigrants | Singapore
98.9
/100
|
#72
Exceptional
85.0%
Immigrants | Sri Lanka
98.9
/100
|
#73
Exceptional
85.0%
Colombians
98.8
/100
|
#74
Exceptional
85.0%
Immigrants | South Central Asia
98.7
/100
|
#75
Exceptional
85.0%
Immigrants | Cuba
98.6
/100
|
#76
Exceptional
84.9%
Immigrants | Turkey
98.6
/100
|
#77
Exceptional
84.9%
Immigrants | Africa
98.4
/100
|
#78
Exceptional
84.9%
Peruvians
98.3
/100
|
#79
Exceptional
84.9%